
Our trading signal analysis is based on a comprehensive summary of market data. We use a range of metrics with weighting given to simple and exponential moving averages and key technical indicators.
We created this Weekly Tips section to share possible trade entry and exit points based on technical analysis. We also have other methods to validate our trades which we can’t publicly share that help to increase their success. All our trades include entry and at least one target price. Stop-losses are applied at reader discretion. Our strategies typically trade with a wide stop-loss, and risk is further mitigated by trading in small sizes.
Instrument | Hourly | Daily | |
EUR/USD | 1.1286 | Neutral | Strong Sell |
GBP/USD | 1.3441 | Strong Buy | Strong Sell |
USD/JPY | 7,302 | Strong Sell | Neutral |
S&P 500 | 4,625 | Strong Sell | Sell |
NASDAQ 100 | 16,177 | Strong Sell | Sell |
FTSE100 | 7,094 | Neutral | Strong Sell |
Gold | 1,798 | Strong Buy | Sell |
Crude Oil WTI | 71.29 | Neutral | Strong Sell |
Bitcoin | 56,805 | Buy | Neutral |
Ethereum | 4,288 | Buy | Strong Buy |
UTC 07.36
FOCUS ON: INDICES TRADE SIGNALS
A return to risk-on trading last week was channelled through global equity indices. The S&P 500 and Nasdaq 100 indices were up 3.87% and 4.36%, respectively. Both numbers beat the more ‘speculative’ and often more volatile crypto markets where BTC was up 2.85% and Ethereum only 0.18%.
Are equity index prices forming a bubble? One clue could be the reaction to the US inflation data, which came out on Friday. The US CPI number showed inflation in November was 6.8% higher than a year ago and at the highest levels since 1982. Shaking off the risk that inflation could squeeze corporate earnings and bring about hawkish monetary policy, equities continued to show strength.
The failure to break key resistance levels has left indices exposed to the risk of being over-extended on a short-term basis. With the US Fed, Bank of Japan, European Central Bank, and Bank of England updating the markets on policy this week, downward price movement is a risk. It’s not beyond the imagination that dovish moves by central bankers bring about another surge in buying pressure. Still, with so many banks reporting in one week, it could be a time for false breakouts in either direction.
Nasdaq 100
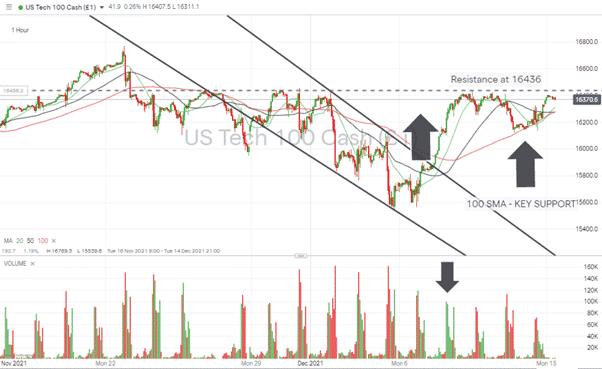
Nasdaq 100 1H Chart – Upwards Breakout on Lower Volume. SMA Support vs Price High Resistance
Source: IG
Tuesday’s breakout of the downward wedge pattern was dramatic in terms of price action, but there was a notable absence of any uptick in trading volumes. It looks like the bears just got out of the way until the price-high resistance at 16,436. Every attempt by price to break through that level failed, but the hourly 100 SMA provided support.
Short positions
- Entry Level 1: Region of 16,436. Price high of last week and confirmed resistance level from November.
- Price Target 1: 100 SMA on 1H chart – currently in the region of 16,275.
- Price Target 2: 15,860 price at which Tuesday’s wedge breakout occurred.
- Stop Loss: Outside of the top range of trading channel >16,436.
S&P 500
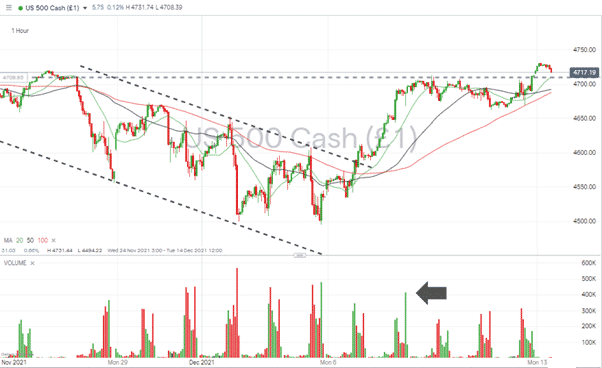
S&P 500 1H price chart – Breakout of Downward Wedge
Source: IG
The S&P 500 followed a similar path to the Nasdaq. The returns in percentage terms may have been lower in the 500, but price action was more bullish with price not needing support from moving averages and managing to break the resistance level 4,713. There was also an uptick in volume associated with the initial breakout.
Short positions
- Entry Level 1: 4,713 – Resistance level which was broken on Thursday, but which price looks likely to revisit.
- Entry Level 2: 20 SMA on the hourly chart, currently at 4,710.
- Price Target 1: Either of the 50 and 100 SMA currently in the region of 4688 and 4692.
- Price Target 2: 4,600 psychologically important price level.
- Stop Loss: Outside of the top range of trading channel > 4,713.
FTSE 100
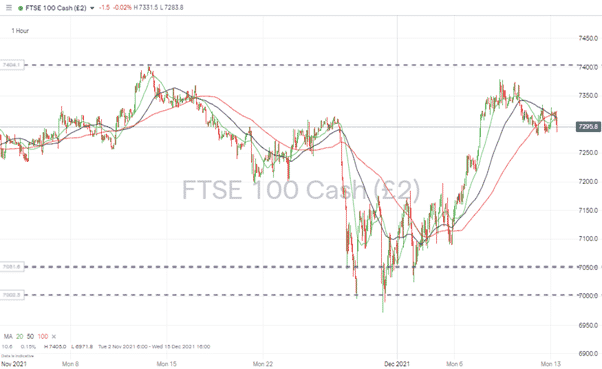
Due to Brexit and general political uncertainty, long-running drags on economic performance have left the FTSE trading a more sideways pattern than its US counterparts. A break above 7,400 would result in the path of least resistance being upwards, but a bounce off that resistance brings about the possibility of price heading towards support at 7,050 and 7,000.
FTSE 100 – 1H price chart –Range-bound trading and tied up in SMA’s.
Source: IG
Long positions
- Entry Level 1: 7400 – Breakout through resistance level.
- Price Target 1: Open-ended – February 2020 was the last time price traded near that level.
- Stop Loss: Below trade entry point and SMA’s that are currently converging, ranging between 7169 and 7214.
Short positions
- Entry Level 1: Region of 7,400. Price high of the 12th of November and year-to-date high.
- Price Target 1: SMA’s which are currently converging, ranging between 7,169 and 7,214.
- Price Target 2: 7,000 – 7,050 bottom of sideways channel and ‘big number’ support levels.
- Stop Loss: Outside of the top range of trading channel.
Forex
With the coming week marked by so many Central Bank announcements, it was little surprise that currency markets trod water over the last seven days. Between Monday the 6th and the 13th December, GBPUSD and EURUSD were down 0.19% and 0.12%, respectively and USDJPY up 0.29%.
GBP/USD
The US Federal Reserve will announce interest rates on Wednesday and on Thursday 16th December the Bank of England will release the minutes of the previous Monetary Policy Committee meeting. Expect more sideways trading until traders come across those markers in the road.
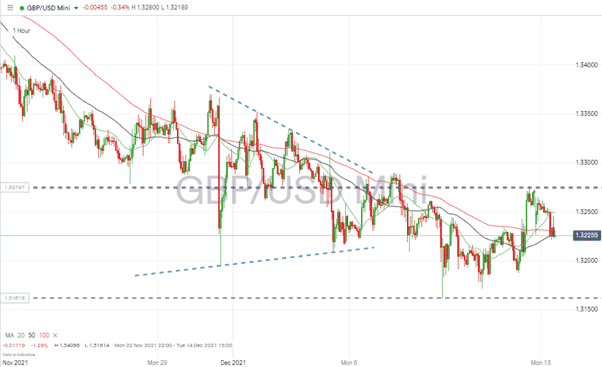
GBP/USD – 1H chart – Price funnelled to the end of the wedge pattern then carried on moving sideways
Source: IG
Long positions
- Entry Level 1: 1.3,161 Bottom of sideways channel – price low of 8th December.
- Price Target 1: 20, 50 and 100 SMAs, which are bunched and currently trading in the region of 1.322 – 1.325.
- Price Target 2: 1.3275 Top of sideways trading channel.
Short positions
- Entry Level 1: 1.3275 Top of sideways channel.
- Price Target 1: 20, 50 and 100 SMAs, which are bunched and currently trading in the region of 1.322 – 1.325.
- Price Target 2: 1.3161 Low of 8th December and bottom of sideways channel.
- Stop Losses: Outside of top/bottom of trading. Strong arguments for setting them tight as a breakout to the upside or downside could be driven by material news being shared in the Central Bank announcements.
EUR/USD
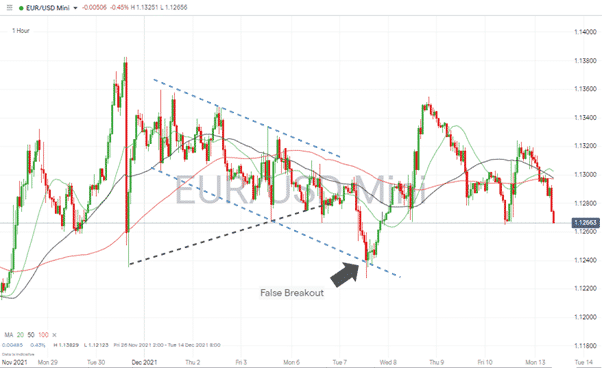
The ECB makes its interest rate announcement on Thursday and the not insignificant inflation number for the Eurozone is released on Friday. Expect more sideways trading until the statements are made with the potential for new trends to follow.
EUR/USD – 1H chart – False breakout followed by a short-lived rally
Source: IG
Long positions
On Tuesday, 7th December, the false breakout saw price clip 1.1227 before rebounding. Below the strong support at the level of 1.227.
- Entry Level 1: 1.1280 Swing low of Friday morning.
- Price Target 1: 1.1300 Psychologically important price level and current home to 20, 50 and 100 SMAs.
- Price Target 2: 1.132 Friday’s high.
- Stop Losses: Below the strong support at the level of 1.227.
Short positions
- Entry Level 1: A break to the downside through 1.1280 swing low of Friday.
- Price Target 1: Last week’s low of 1.227.
- Stop Losses: > 1.1300 Psychologically important price level and current home to 20, 50 and 100 SMAs.
As with GBP/USD, there are arguments for setting stop losses tight as a breakout to the upside or downside could be driven by material news being shared in the central bank announcements.
USD/JPY
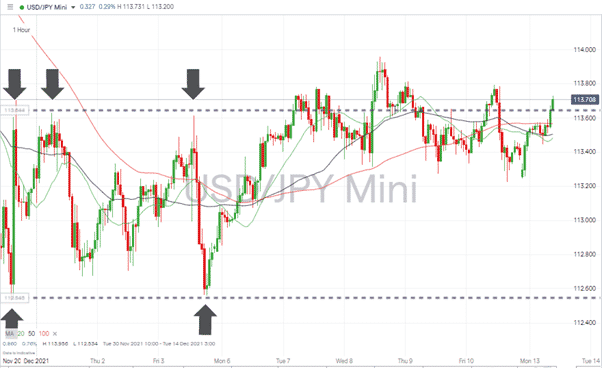
Attempts to break through the resistance at 113.60 keep coming but have proved inconclusive. Despite the failures to break to the upside, the price consolidation is still a bullish signal. Japan’s trade balance report due on Wednesday could act as a catalyst for currency moves.
USD/JPY – 1H chart – Price consolidation near key resistance level
Source: IG
Long positions
On Wednesday, 8th December, the false breakout saw price clip 113.95 before retreating. A break above that level could signal the bullish price action finally holding sway.
- Entry Level 1: 113.95 Last week’s high–breakout strategy.
- Price Target 1: 115.34 High of 25th of November.
- Stop Losses: Below the support provided by the bottom end of the trading channel at the level of 112.52
Crypto – Bitcoin & Ethereum
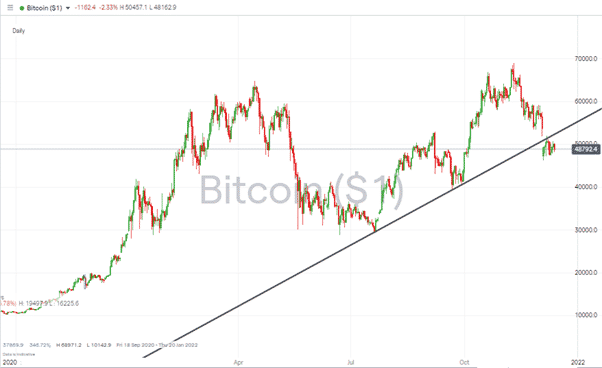
Bitcoin has rebounded harder than Ethereum. BTC up 2.85% on the week and ETH up 0.18%. It could be a dead-cat bounce with both coins trading near significant long-term trend line support levels.
Bitcoin – 1D price chart – Trading below the supporting trend line
Source: IG
Long positions
- Entry Level 1: 46,676 – low of 3rd December.
- Price Target 1: 52,130 current level of the long-term trend line, which now acts as resistance.
- Price Target 2: If the swing-low formation holds and price action does show higher highs and higher lows, then a break of the long-term trend line would open the way to a test of the November high of 68,972.
Stop Losses: The trendline means there’s not much headroom until the first price target is met. Trading in small size would appear to be prudent.
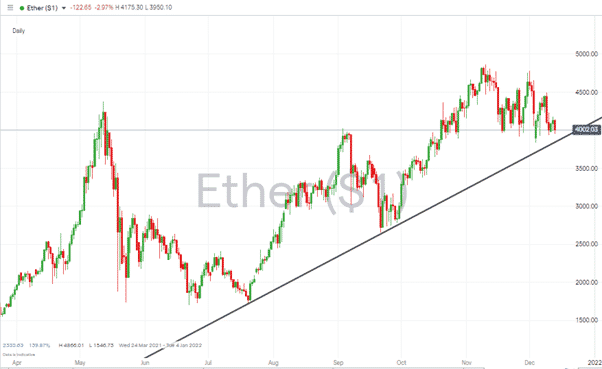
Ethereum – 1D price chart – Supporting trend line still holds for ETH
Source: IG
Long positions
- Entry Level 1: 4,000 Psychologically important price level.
- Entry Level 2: 3,880 current level of long-term trendline support.
- Price Target 1: 4,866 high of 10th of November.
- Stop Losses: The trendline offers a convenient guide for stop losses with trader discretion to be applied on how far below that price level is.
Oil (US Crude)
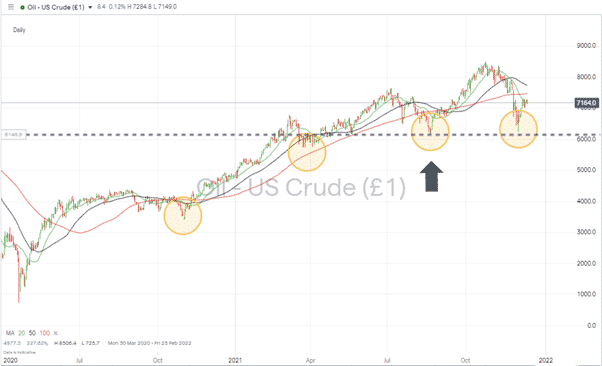
The daily chart for oil shows the year-long bull run is still intact – just. If price can stay above the swing-low of $61.73 on 22nd August, the path of least resistance would appear to be the upside. Fundamentals could come into play in the form of geopolitical tension on the Russia-Ukraine border and talk of Western governments cutting off Russian gas supplies as part of economic sanctions.
Oil – 1D price chart – Swing-low pattern still holds
Source: IG
Long positions
- Entry Level 1: Between current price and support level at $61.73.
- Price Target 1: 100 SMA currently at $74.65.
- Price Target 2: 50 SMA currently at $77.53.
- Stop Losses: Below swing-low at $61.73.
Gold
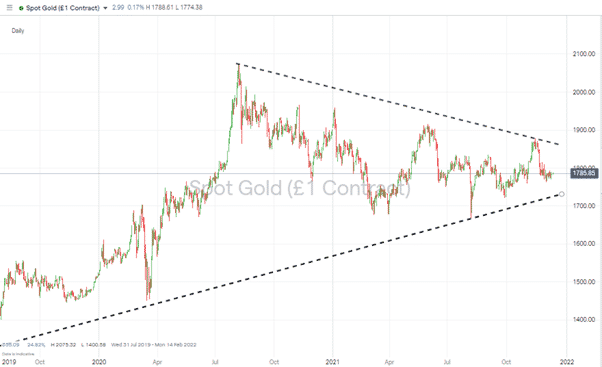
The wedge pattern forming on the multi-year price chart has brought the price of gold into a tight trading range. The interest rate announcement due from the Fed could cause a breakout of that tight trading range. Until Wednesday, expect more range-bound trading between 1,762 and 1,794.
Gold – 1D price chart – Wedge Pattern dating back from 2019
Source: IG
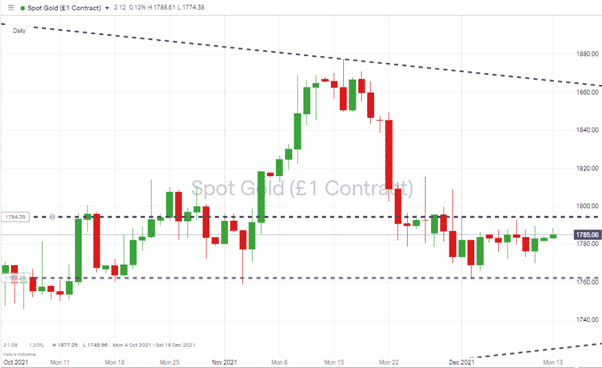
Gold – 1D price chart – Tight Trading Range
Source: IG
Long positions
- Entry Level 1: 1,762 – Support at the lower end of the price channel.
- Price Target 1: 1,794 – Resistance at the upper end of the price channel.
- Stop Loss: Below trade entry point and support at 1,762.
Short positions
- Entry Level 1: 1,794 – Upper end of the price channel.
- Price Target 1: 1,762 – The lower end of the price channel.
- Stop Loss: Above trade entry point at 1,794.
Risk Statement: Trading financial products carries a high risk to your capital, especially trading leverage products such as CFDs. They may not be suitable for everyone. Please make sure that you fully understand the risks. You should consider whether you can afford to take the risk of losing your money.

Forextraders' Broker of the Month
BlackBull Markets is a reliable and well-respected trading platform that provides its customers with high-quality access to a wide range of asset groups. The broker is headquartered in New Zealand which explains why it has flown under the radar for a few years but it is a great broker that is now building a global following. The BlackBull Markets site is intuitive and easy to use, making it an ideal choice for beginners.