Our trading signal analysis is based on a comprehensive summary of market data. We use a range of metrics with weighting given to simple and exponential moving averages and key technical indicators.
We created this Weekly Tips section to share possible trade entry and exit points based on technical analysis. We also have other methods to validate our trades which we can’t publicly share that help to increase their success. All our trades include entry and at least one target price. Stop losses are applied at a reader’s discretion. Our strategies typically trade with a broad stop loss, and risk is further mitigated by trading in small sizes.
Instrument | Hourly | Daily | |
EUR/USD | 1.1320 | Strong Buy | Buy |
GBP/USD | 1.3436 | Strong Buy | Strong Buy |
USD/JPY | 114.81 | Sell | Strong Buy |
S&P 500 | 4,798 | Strong Buy | Strong Buy |
NASDAQ 100 | 16,618 | Strong Buy | Strong Buy |
FTSE100 | 7,445 | Strong Buy | Strong Buy |
Gold | 1,815 | Strong Buy | Strong Buy |
Crude Oil WTI | 75.78 | Strong Buy | Strong Buy |
Bitcoin | 49,357 | Strong Sell | Sell |
Ethereum | 3,915 | Strong Sell | Sell |
UTC 08:42
FOCUS ON: YEAR-END RALLY
The Santa Rally came late this year, but from 20th to 28th December, a torrent of buying pressure caused some asset prices to surge. The S&P 500 and Nasdaq 100 are up more than 5% over the period – 5.27% and 6.55%, respectively. Oil prices have rallied by an eye-watering 11.36% despite any major flare-ups in terms of geopolitical risk.
Is this just a seasonal blip? Possibly. For starters, cryptocurrencies, the natural home for more speculative traders, have underperformed with BTC and ETH posting weekly gains of 6.78% and 2.46%, respectively.
A bigger amber, if not a red flag, is provided by the Forex markets. Euro and Sterling both gained ground against the US dollar, up 0.61% and 1.79%, but at the same time, the USDJPY forex pair moved 1.24% in the other direction. Gold’s view on the situation is decidedly “meh”, with the metal recording an 83-basis point price rise, suggesting that inflation and interest fears were not the main price drivers of the rally. This means the much-quoted “end-of-year book adjustments” by big institutional equity investors may be what caused the price rise. That group of investors are incentivised to help equity prices rally into the finishing stretch of the year and post impressive returns for investors. Not for the first time, fund performance statistics and traders’ bonuses have been improved by letting prices push higher in low-volume trading.
Nasdaq 100
Nasdaq 100 Daily Chart – Steep Gradient Targeting Price High Resistance & Falling Volumes
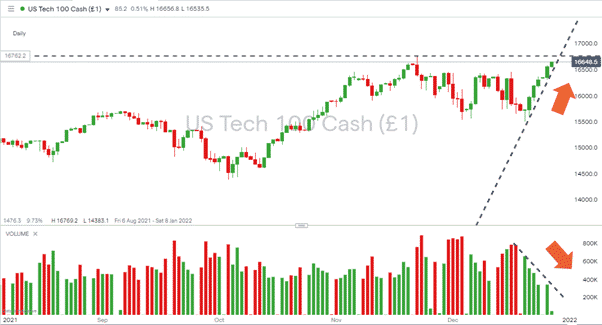
Source: IG
The remarkably steep gradient of Nasdaq’s daily price chart is mirrored by a fall in trading volumes over the same period. With light trading set to continue until the new year, there’s every chance the price could continue to rise and at least clip the all-time-high of 16,769 on 22nd November.
Long positions
- Entry Level 1: Region of 16,644 buying into short-term dips with the aim of riding upward momentum
- Price Target 1: Price High resistance at 16,769
- Stop Loss: Trailing stop below upwards price trendline
Short positions
- Entry Level 1: 16,769 Price High resistance
- Entry Level 2: Any break of supporting trendline
- Price Target 1: Region of 16,180 – 50 Daily SMA
- Price Target 2: 16,074 – 16,132 – 50% Fib retracement from 20th December low
- Stop Loss: Above Price High resistance at 16,769
S&P 500
The S&P 500 index is running moves from the same playbook as the Nasdaq. A steep price rise was matched by falling trade volumes, but one difference being the S&P had broken through the high of 4,752 on 16th December. That 4,750 price range formed significant resistance for the past month (see the high of 4,743 on 22nd November) and now forms substantial support.
S&P 500 Daily Chart – Steep Gradient Targeting Price High Resistance & Falling Volumes
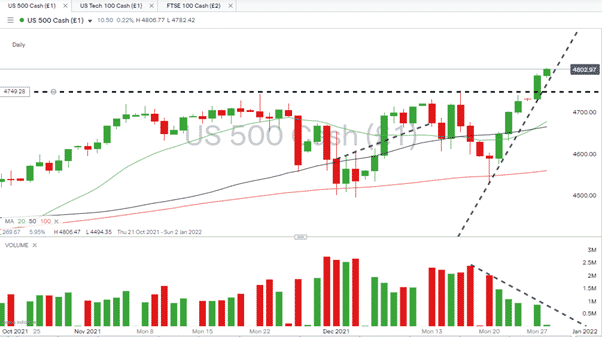
Source: IG
Long positions
- Entry Level 1: 4,750 Any pullback to test the support line in the region of 4,750 could be expected to be met with further buying pressure.
- Entry Level 2: +4,750 More aggressive buyers might not be able to resist the temptation to buy into price weakness above the 4,750 level.
- Price Target 1: Time related. The current path of least resistance appears to be upwards, but the market mood could change when the markets get back to full strength next week.
Short positions
- Entry Level 1: Any break of the supporting trendline
- Price Target 1: 4,752 – Price high of 16th December
- Price Target 1: 4,743 – Price high of 22nd November
FTSE 100
The FTSE 100 gained 4.37% over the last week, which is a handsome return for a somewhat unloved market; however, it still underperformed its US rivals.
FTSE 100 Daily Chart – Steep Gradient Targeting Price High Resistance & Falling Volumes
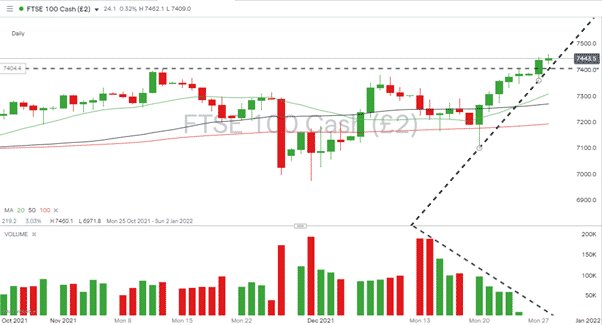
Source: IG
Long positions
- Entry Level 1: 7,404 – Former resistance level which now offers support
- Price Target 1: 7,690 – Price high of pre-Covid 2020
- Stop Loss: < 6,971 – Below supporting trend line and swing low of 30th November
Short positions
- Entry Level 1: 7,404 Break of supporting price high resistance of 12th November and ‘big number’ price level of 7,400
- Price Target 1: 7,000 – ‘Big number’ and trendline support level
- Stop Loss: >7,404 or month-to-date high
Forex
The US Dollar index has continued to form a consolidation pattern with different currencies in the basket finding relative strength and others experiencing weakness.
GBPUSD
Sterling was last week’s big winner, with GBPUSD posting a 1.79% gain.
GBPUSD – 1DH chart – Trading in the middle of a Downward Channel
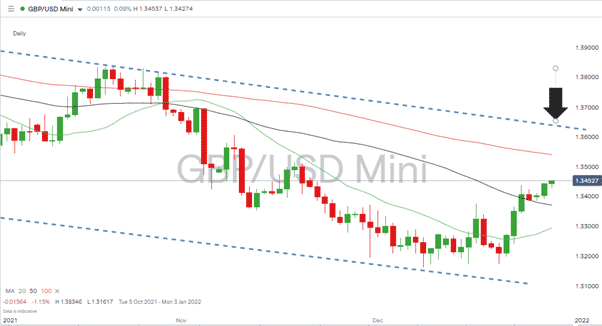
Source: IG
Long positions
- Entry Level 1: In the region of 1.337 – 50 Daily SMA and midpoint of downwards channel
- Price Target 1: In the region of 1.337 – 50 Daily SMA and midpoint of downwards channel
- Price Target 2: In the region of 1.364 – upper trend line of downwards channel
- Stop Losses: > 1.330 – Big number price level and 20 Daily SMA
Short positions
- Entry Level 1: In the region of 1.354 – 100 Daily SMA
- Entry Level 2: In the region of 1.364 – upper trend line of downwards channel
- Price Target 1: In the region of 1.337 – 50 Daily SMA and midpoint of downwards channel
- Price Target 2: 1.31 – In extension, big number price level and bottom of downwards channel
- Stop Losses: > 1.370 – Big number price level which is above downwards channel
EURUSD
Volatility has drained out of the Euro-dollar market over the last week. Further upward price movement will have to navigate resistance.
EURUSD – 1D chart – Consolidation below combined resistance indicators
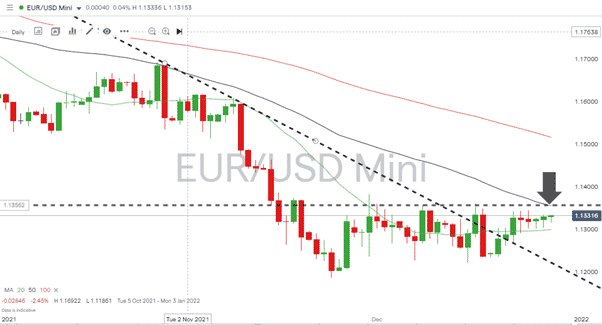
Source: IG
Short positions
- Entry Level 1: 1.3604 – Confluence of December month to date high (16th December) and upper range of downward channel.
- Price Target 1: 1.130 – Big number price level
- Price Target 2: 1.2992 – Region of 20 Daily SMA
- Stop Losses: >1.3620
USDJPY
Dollar-yen’s rising wedge pattern offers a variety of trade entry points. An eye will need to be kept on fundamentals that have resulted in the Yen diverging from Euro and Sterling over the last week.
USDJPY – 1H chart – New wider Sideways Channel
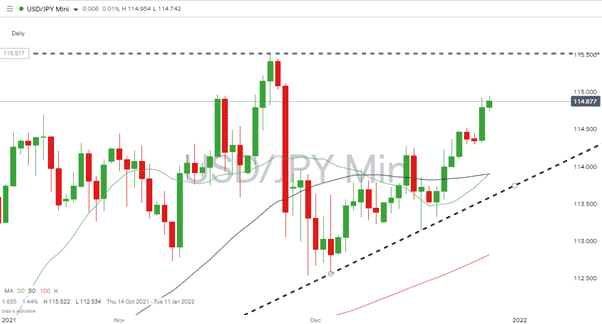
Source: IG
Long positions
- Entry Level 1: 113.9 – Region of 20 and 50 Daily SMAs and above supporting trendline
- Price Target 1: 115.5 – Top of range of rising wedge pattern. High of 24th November.
- Stop Losses: Below the supporting trend line, 100 Daily SMA in extension
Short positions
- Entry Level 1: 115.5 – Top of range of rising wedge pattern. High of 24th November
- Price Target 1: 113.9 – Region of 20 and 50 Daily SMAs
- Stop Losses: Above the top end of the wedge pattern
Crypto – Bitcoin & Ethereum
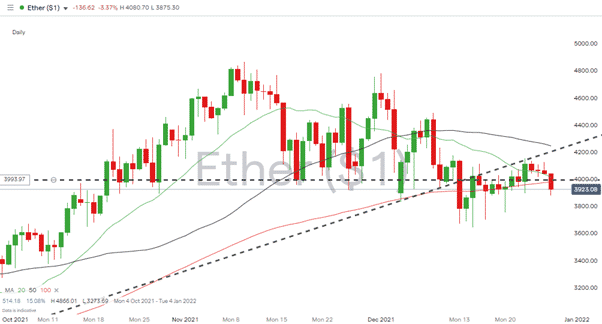
In a relatively quiet week for cryptos, the two major coins arrested their recent steep declines. The consolidation at lower levels could point to the next move being either up or down. Both Bitcoin and Ethereum will need to find the strength to push through psychologically important price levels of $50,000 and $4,000, respectively.
Bitcoin – 1D price chart – Consolidating – but below the supporting trend line and $50,000
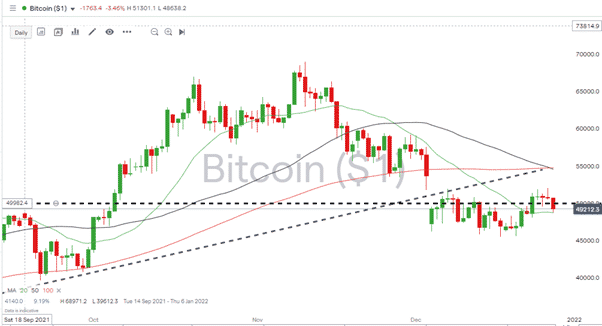
Source: IG
Long positions
- Entry Level 1: 50,000 – Big number price level
- Price Target 1: 54,000 – Current location of the previous supporting trend line and 50 and 100 Daily SMAs
Ethereum – 1D price chart – Consolidation around $4,000 price level
Source: IG
Long positions
- Entry Level 1: 4,000 – Psychologically important price level
- Price Target 1: 4,200 – 4,250 – Current location of the previous supporting trend line and 50 Daily SMA
- Price Target 2: 4,866 – High 10th November
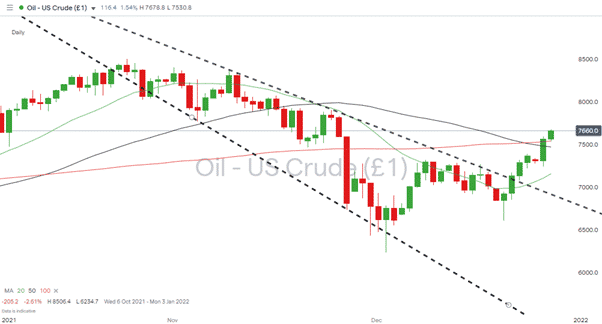
Crude Oil (WTI)
Crude oil is still holding its multi-month bullish trade pattern, and there are few reasons to argue against it reaching the November highs of $85 p/barrel.
Crude Oil (WTI) – 1D Price Chart – Break out of downward channel
Source: IG
Long positions
- Entry Level 1: 75.40 – Pullbacks to 100 Daily SMA
- Price Target 1: $85.06 – Price high of 25th October
- Stop Losses: In the region of $66.00 – Below the upper trend line and big number support at $70.00
Risk Statement: Trading financial products carries a high risk to your capital, especially trading leverage products such as CFDs. They may not be suitable for everyone. Please make sure that you fully understand the risks. You should consider whether you can afford to take the risk of losing your money.

Forextraders' Broker of the Month
BlackBull Markets is a reliable and well-respected trading platform that provides its customers with high-quality access to a wide range of asset groups. The broker is headquartered in New Zealand which explains why it has flown under the radar for a few years but it is a great broker that is now building a global following. The BlackBull Markets site is intuitive and easy to use, making it an ideal choice for beginners.