
Our trading signal analysis is based on a comprehensive summary of market data. We use a range of metrics with weighting given to simple and exponential moving averages and key technical indicators.
We created this Weekly Tips section to share possible trade entry and exit points based on technical analysis. We also have other methods to validate our trades which we can’t publicly share that help to increase their success. All our trades include entry and at least one target price. Stop losses are applied at the reader’s discretion. Our strategies typically trade with a wide stop loss, and risk is further mitigated by trading at small sizes.
Instrument | Hourly | Daily | |
EUR/USD | 1.1293 | Strong Sell | Strong Sell |
GBP/USD | 1.3487 | Strong Buy | Strong Buy |
USD/JPY | 115.84 | Strong Buy | Strong Buy |
S&P 500 | 4,803 | Strong Buy | Strong Buy |
NASDAQ 100 | 16,503 | Strong Buy | Strong Buy |
FTSE100 | 7,479 | Strong Buy | Strong Buy |
Gold | 1,804 | Strong Sell | Neutral |
Crude Oil WTI | 76.30 | Strong Buy | Strong Buy |
Bitcoin | 46,435 | Strong Buy | Strong Sell |
Ethereum | 3,766 | Strong Sell | Sell |
UTC 09:58
FOCUS ON: START OF THE YEAR
Momentum drained out of the Santa Rally in the last week of December, but those who managed to catch the price moves at the right time still had a chance to post sizeable gains. The S&P 500 finished December up 3.98%, and USDJPY was up 1.6% on the month.
With institutional traders returning to their desks and making their appraisals of valuations after the holiday break, markets have started the new year trending sideways. The recent short-term spike in various asset groups has marked a return to the upper levels of longer-term trading channels rather than a breakout into a new pattern.
The question is whether big-money investors mapping out their playbook for 2022 take current valuations as a valid starting place or start injecting their capital allocation according to longer-term valuations.
In terms of fundamentals and news releases, the opening week of January is a relatively quiet one for most asset groups. The US Non-Farm Payroll numbers are released on the 7th January, but it will be oil traders who will get the least amount of time to settle back into things with the OPEC+ ministerial meeting taking place on Tuesday 4th January.
Crude Oil (WTI)
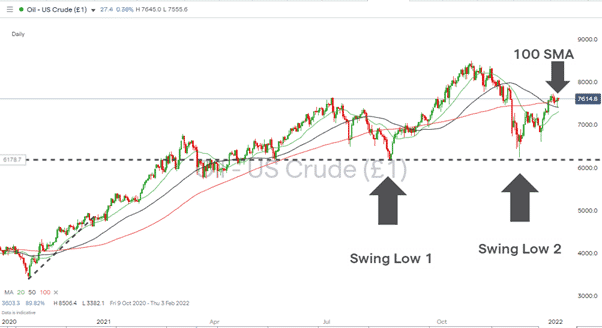
Crude Oil (WTI) Daily Chart – Key price indicators coming into play
Source: IG
OPEC’s decision to increase oil production by 400,000 barrels per month has done little to dampen the price of crude. The multi-month bull run, which coincided with the return to economic normality in 2021, has so far held its bullish pattern. However, some key indicators could come into play if over-supply and Covid fears begin to nag on those holding long positions.
The swing low of 2nd December (Swing Low 2) tested but didn’t break Swing Low 1 61.73 from 22nd August. While that level holds, the bullish pattern remains, but short-term trades will be focussed on the 100 Daily SMA, which has been acting as a magnet for price since 27th December.
Long positions
- Entry Level 1: 75.82 – In the region of the current level of 100 Daily SMA
- Price Target 1: 85.06 – Price high of 25th October
- Stop Loss: Below 100 Daily SMA
Short positions
With the 50 Daily SMA cutting through the 100 SMA to the downside on 22nd December, there is room for downwards price movement.
- Entry Level 1: 75.82 – In the region of the current level of 100 Daily SMA
- Price Target 1: 74.09 – In the region of the current level of 50 Daily SMA
- Price Target 2: 73.12 – In the region of the current level of 20 Daily SMA
- Price Target 3: 61.73 – Swing Low 1st August
- Stop Loss: Above 100 Daily SMA
Indices
Nasdaq 100
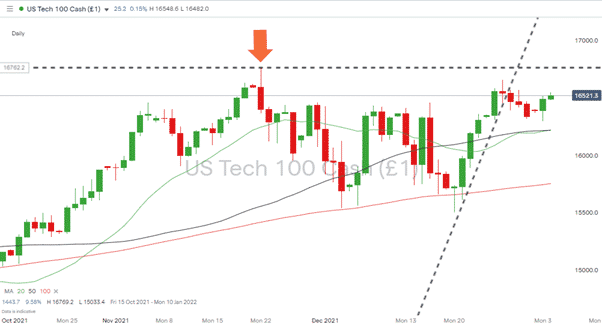
Nasdaq 100 Daily Chart – Steep gradient targeting price high resistance & falling volumes
Source: IG
A break of the Santa Rally trend line was identified as a strong possibility in the report of the 28th of December. The air was just getting very thin for the stocks which make up the index, and although price broke through the support, it didn’t fall away dramatically. The Santa rally appears to have been little more than a move up to the upper end of a sideways trading channel, and the resistance from the all-time high of 16,769 on the 22nd of November will be more of a concern for the bulls.
Long positions
- Entry Level 1: 16,218 – In the region of 20 and 50 Daily SMAs. Buying into short-term dips which clip the key support levels.
- Price Target 1: Price High resistance at 16,769
- Stop Loss: Below 20 and 50 Daily SMAs
Short positions
- Entry Level 1: 16,769 Price High resistance
- Price Target 1: 16,180 – In the region of 50 Daily SMA
- Price Target 2: 16,218 – Confluence of 20 and 50 Daily SMAs
- Stop Loss: Above Price High resistance at 16,769
S&P 500
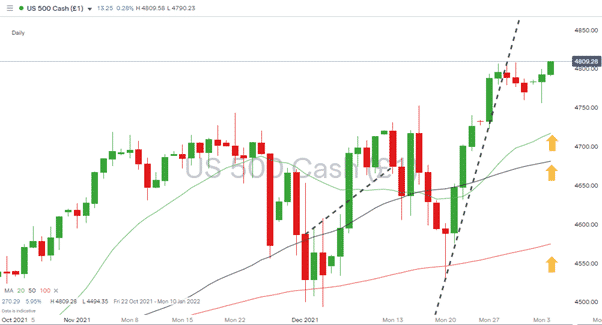
As with the Nasdaq, the S&P 500 broke its Santa Rally supporting trend line, but unlike its tech-heavy peer, the S&P found further strength and went on to post an all-time high on Tuesday, 4th January. With the Daily SMAs also aligned in a bullish pattern, the path of least resistance appears to be upwards.
S&P 500 Daily Chart – Path of least resistance appears to be upwards
Source: IG
Long positions
- Entry Level 1: 4,806 Any pullback to test the support line formed by the previous price high of December the 28th.
- Price Target 1: Time related. With a light news agenda, price could drift upwards until US unemployment reports are released on Friday, 7th January.
- Stop Loss: Trailing. To take advantage of the market drifting upwards before NFP data on Friday.
FTSE 100
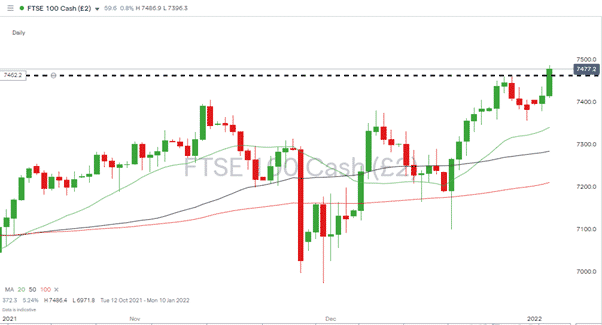
The UK’s benchmark index has formed a price pattern similar to the S&P 500. The Non-Farm Payroll jobs data due on Friday may be US-specific but will be the big number to watch out for this week.
FTSE 100 Daily Chart – Path of least resistance appears to be upwards
Source: IG
Long positions
- Entry Level 1: 7,461 Any pullback to test the support line formed by the previous intraday price high of the 29th of December
- Price Target 1: Time related. With a light news agenda, price could drift upwards until US unemployment reports are released on Friday, 7th January.
- Stop Loss: Trailing. To take advantage of the market drifting upwards prior to NFP data on Friday
Forex
Currency moves over the holiday have not been on the same scale as those in the equity markets. The risk-on move in stocks is also a divergence from forex moves which point towards continued US dollar strength.
GBPUSD
Sterling’s strong run through December has taken it towards the outer limits of its long-term downwards channel. A breakout to the upside can’t be discounted, but even if it does come about, some near term price consolidation can be expected.
GBPUSD – 1D chart – Long-term downwards channel still holds
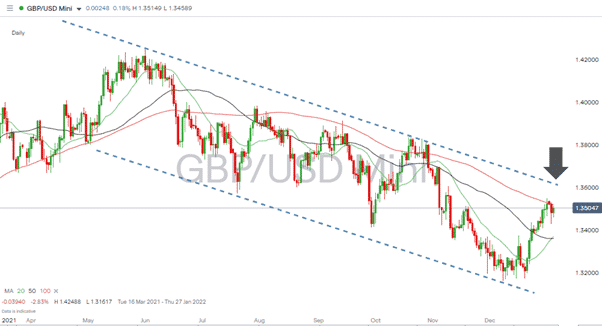
Source: IG
Long positions
- Entry Level 1: 1.36 – In the region of the upper trend line of the downwards channel. Breakout strategy.
- Price Target 1: 1.424 – Price high of June 2021.
- Stop Losses: 1.35 – In region of former resistance trend line converted to supporting role and 100 Daily SMA.
Short positions
- Entry Level 1: 1.36 – In the region of upper trend line of the downwards channel. Downwards channel strategy.
- Entry Level 2: 1.135 In the region of 100 Daily SMA.
- Price Target 1: In the region of 1.336 – Convergence of 20 and 50 Daily SMA and midpoint of the downwards channel.
- Price Target 2: 1.31 – In extension, big number price level and bottom of the downwards channel.
- Stop Losses: > 1.370 – Big number price level which is above the downwards channel.
EURUSD
Tests of the resistance level of 1.138 were seen in the last week, and the resistance, which dates to the 30th of November, was held. The rising wedge pattern suggests Eurodollar could trade within a relatively tight trading range for the first trading sessions of the year.
EURUSD – 1D chart – Consolidation in a Rising Wedge pattern
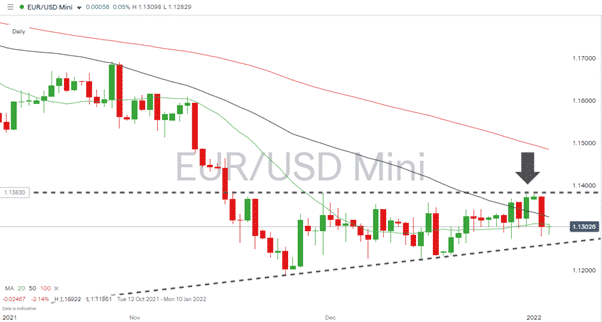
Source: IG
Short positions
- Entry Level 1: 1.138 – Upper resistance of rising wedge pattern.
- Price Target 1: 1.132 – In the region of 50 Daily SMA.
- Price Target 2: 1.126 – Current level of supporting trend line.
- Stop Losses: >1.14 – Big number resistance level.
USDJPY
The breakout of the rising wedge pattern on Tuesday, 4th January could signify the start of a new trend. One eye will need to be kept on US fundamentals, which will be updated on Friday when the jobs numbers come out. Another will be on trading volumes that have not yet increased in size to an extent where they would support the upwards move.
USDJPY – 1D chart – Breakout but low volumes
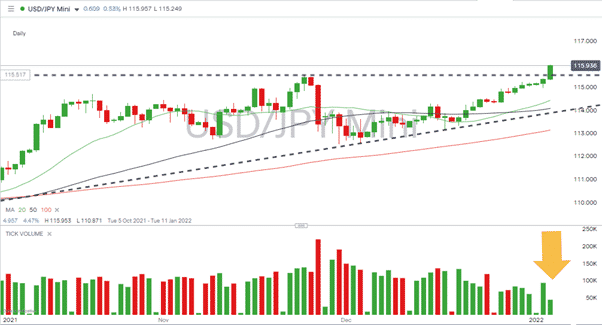
Source: IG
Long positions
- Entry Level 1: 115.5 – Any return to the previous high of 24th November.
- Price Target 1: 118.6 – Price high of January 2017.
- Stop Losses: < 115.5 – Below the resistance/support trend-line.
Crypto – Bitcoin & Ethereum
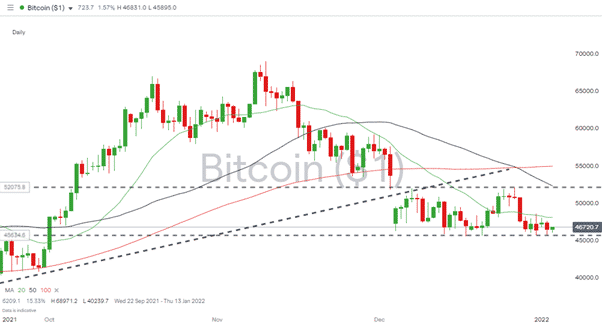
Bitcoin has spent the last month trading in a tight trading range between 45,000 and 52,000, while Ethereum’s more significant weakness has resulted in a downwards wedge pattern forming. While the price moves are relatively conservative for the crypto markets, the divergence is something to keep in mind.
Bitcoin – 1D price chart – Sideways trading in a tight range
 Source: IG
Long positions
- Entry Level 1: 45,573 – Low price mark of Monday 20th December.
- Price Target 1: 50,000 – Psychologically important ‘big number’ resistance level.
- Price Target 1: 52,034 – Resistance trend line.
Ethereum – 1D price chart – Downwards wedge pattern forming
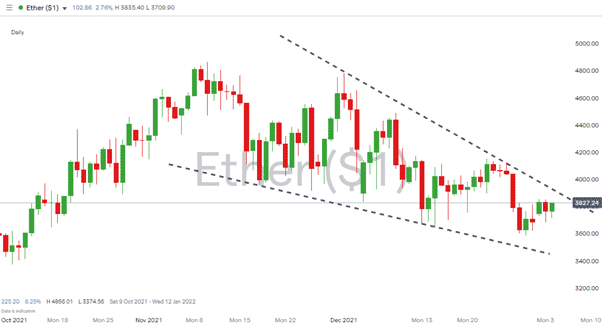
Source: IG
Long positions
- Entry Level 1: 3,421 – In the region of supporting trend line of downward wedge pattern.
- Price Target 1: 3,877 – In the region of upper trend line of downward channel.
Risk Statement: Trading financial products carries a high risk to your capital, especially trading leverage products such as CFDs. They may not be suitable for everyone. Please make sure that you fully understand the risks. You should consider whether you can afford to take the risk of losing your money.

Forextraders' Broker of the Month
BlackBull Markets is a reliable and well-respected trading platform that provides its customers with high-quality access to a wide range of asset groups. The broker is headquartered in New Zealand which explains why it has flown under the radar for a few years but it is a great broker that is now building a global following. The BlackBull Markets site is intuitive and easy to use, making it an ideal choice for beginners.