
Our trading signal analysis is based on a comprehensive summary of market data. We use a range of metrics with weighting given to simple and exponential moving averages and key technical indicators.
We created this Weekly Tips section so that we can share possible trade entry and exit points based on technical analysis. We also have other methods to validate our trades which we can’t publicly share that help to increase their success. All our trades include entry and at least one target price. Stop losses are applied at reader discretion. Our strategies typically trade with a wide stop loss and risk is further mitigated by trading in small size.
Instrument | Hourly | Daily | |
EUR/USD | 1.1430 | Strong Buy | Strong Buy |
GBP/USD | 1.3683 | Strong Sell | Strong Buy |
USD/JPY | 114.36 | Strong Buy | Neutral |
S&P 500 | 4,666 | Sell | Strong Sell |
NASDAQ 100 | 15,591 | Neutral | Strong Sell |
FTSE100 | 7,594 | Strong Buy | Strong Buy |
Gold | 1,822 | Strong Buy | Strong Buy |
Crude Oil WTI | 83.61 | Sell | Strong Buy |
Bitcoin | 42,727 | Strong Sell | Strong Sell |
Ethereum | 3,263 | Strong Sell | Strong Sell |
UTC 09:18
FOCUS ON: US Earnings Season and UK and Asia Data Releases
The Martin Luther King holiday means that US exchanges are closed Monday but despite the week being shortened all eyes will remain focused on the States. The quarterly earnings season kicks off on Tuesday with big banks updating the markets on their end of year performance. Netflix is the first of the big-name tech stocks to announce results with their figures also expected to be released on 18th January.
US earnings can influence the mood of the global markets, but forex specific news is also lined up to be released through the week. Unemployment data from the UK is announced on Tuesday and London currency traders will also be looking out for UK inflation data which is due on Wednesday and could point to the economy overheating. In Europe, business sentiment reports are due Tuesday, and the producer price index is updated on Thursday.
Asian markets kick the week off with China releasing Q4 industrial production, retail sales and unemployment numbers on Monday. The Bank of Japan follows up on Tuesday when it shares its update on interest rate policy.
Indices
Nasdaq 100
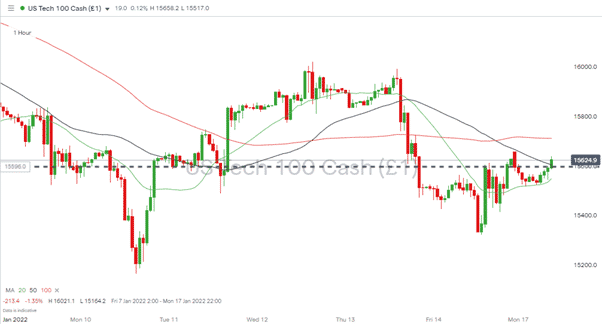
The flagship index for tech-stocks had a rollercoaster week and was at various points 2.5% up and 2.5% down, but from Monday 10th to Monday 17th was unchanged in value. This could reflect prices consolidating at their new lower levels but with investor expectations finely balanced any surprises thrown up by earnings season could send the Nasdaq either way.
Nasdaq 100 Daily Chart – 1hr Candles 10th – 17th January
Source: IG
Long positions
Entry Level 1: 15,509 – This entry level is below the price level at which markets opened on Monday and requires some patience and discipline. If it does come into play it would result in buying into weakness in expectation of earnings news causing a rebound in price. Target entry price is set at the lowest closing price of the previous week (Thursday).
- Price Target 1: 15,784 – Current price level of 100 Daily SMA
- Price Target 2: 16,569 – Year to date price high of the index, printed on 4th January
- Stop Loss: < 15,164 – Lowest level price has reached so far this year. Recorded on Monday of last week.
Short positions
- Entry Level 1: 15,784 – Using the same entry level indicator as for the long position strategy but using any break below 15,784 as a sign of bearish price action to follow.
- Price Target 1: 15,164 – Year-to-date low-price reading.
- Stop Loss: 15,904 – High closing price of previous week, recorded on Wednesday 12th January.
S&P 500
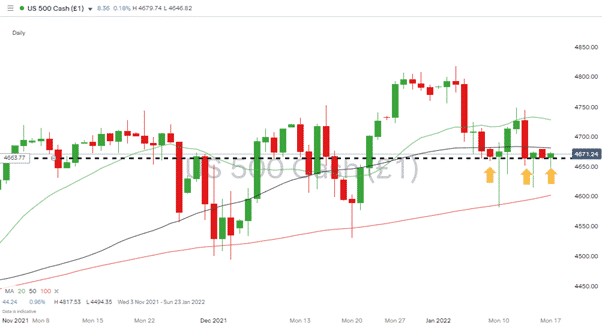
The S&P 500 lost ground to the Nasdaq over the course of the last week but a 0.25% downwards move is in line with historical volatility levels and suggest price in this index is also consolidating in the build-up to earnings season.
S&P 500 Daily Chart – Finding Support at Key Price Level
Source: IG
Long positions
Entry Level 1: 4,664 – The daily price chart shows there is significant support in the region of 4,664. Over the last 8 trading sessions price has closed near to that level on three occasions and rallied the next day. Those rallies have been relatively small but could become more significant should some of the firm’s releasing figures this week beat analyst expectations.
- Price Target 1: 4,748 – Price high of week starting 10th January
- Stop Loss: 4,640 – 61.8% Fib retracement
- Stop Loss: >4,581 – Year-to-date low of Monday 10th January
FTSE 100
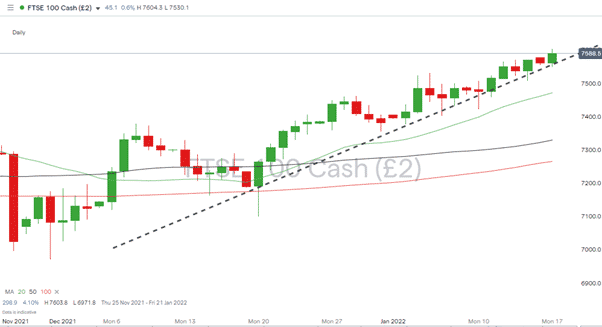
The UK’s benchmark index has recently outperformed its US peers and was up 1.52% in the week between 10th and 17th January. It could be benefitting from a rotation into the cyclical and banking stocks which make up a lot of its membership.
FTSE 100 Daily Chart – November 2021 – January 2022
Source: IG
Long positions
- Entry Level 1: 7,564 The path of least resistance appears to be upwards and this potential breakout has a lot of headroom before running into historical resistance levels.
- Price Target 1: 7,693 – January 2020 and 24-month price high
- Stop Loss: 7,548 – The supporting trend line allows for stop losses to be set relatively close to the trade entry point. 7,548 also marks the week-to-date low recorded on 17th January.
Forex
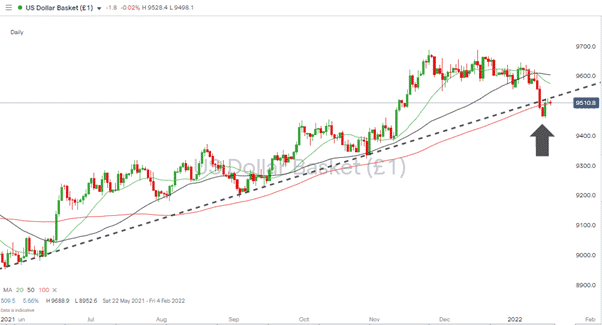
The US dollar had a bad week and gave up ground to a range of other currencies. Whether this marks a temporary set back or the forming of a new trend remains to be seen. With US jobs and inflation data not due out for some time it will be the reports form the UK, EU and Japan which set the tone for the coming week.
US Dollar Basket Index Daily Chart – Long Term Trendline Support Breaks
Source: IG
GBPUSD
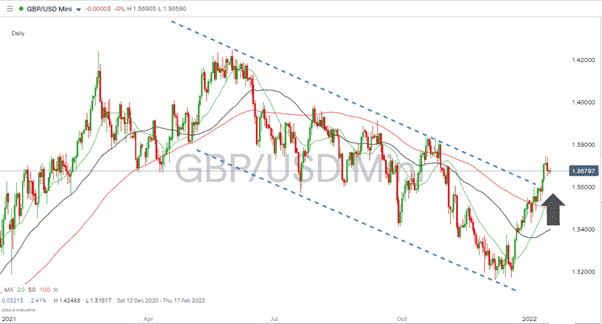
Cable has broken out of its downward channel with some considerable momentum. Short-term weakness and a revisit to the upper trend line of the previous trading range can’t be discounted but would offer an opportunity for GBP bulls to reload on positions.
GBPUSD – 1D chart – Breakout of long-term downwards channel
Source: IG
Long positions
- Entry Level 1: 1.356 – Interpreting the upper trend line as support rather than resistance and using it to enter into trades based on a breakout strategy.
- Price Target 1: 1.3748 – Year-to-date price high printed on Thursday 13th January.
- Stop Losses: 1.35 – In region of former resistance trend line converted to supporting role and 100 Daily SMA
EURUSD
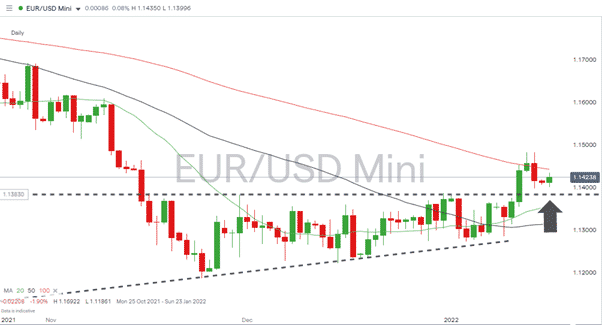
Like GBPUSD the euro-dollar pair last week broke out of a long-term trading channel. There is less economic data due out of eurozone than London this week so without major changes to fundamental analysis metrics any fall back in price to 1.138 can be expected to be met by buying pressure.
EURUSD – 1D chart – Break Out Above Resistance Price Level
Source: IG
Short positions
- Entry Level 1: 1.138 – This price level marks the upper trend line of the channel which dates back to November 2021. What was previously a resistance level can now be expected to offer support and would mark a good trade entry point for those who expect the pounds strong run to continue.
- Price Target 1: 1.14423 – In region of 100 Daily SMA
- Price Target 2: 1.14817 – Year-to-date price high printed on Thursday 13th January.
- Stop Losses: >1.138 – Below supporting trend line
Crude Oil (WTI)
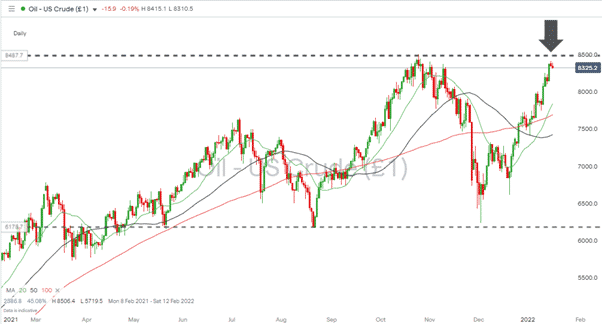
Crude found renewed strength last week and posted a +6% return. Geopolitical tensions continue to influence the energy markets and solidarity among OPEC members is also helping oil prices to continue to climb. Profit taking can’t be ruled out as price moves towards the upper end of the sideways trading channel which dates back to October 2021.
Crude Oil (WTI) Daily Chart – Nearing top of Trading Channel
Source: IG
Short positions
- Entry Level 1: 85.00 Price high of October 2021, and also the 24-month price high. With technical indicators pointing to price rises selling in the region of $85 could more likely take the form of holders of oil assets lightening their positions rather than naked shorts being placed.
- Price Target 1: 76.90 – In the region of current level of 100 Daily SMA
- Stop Loss: > 85.00
Crypto – Bitcoin & Ethereum
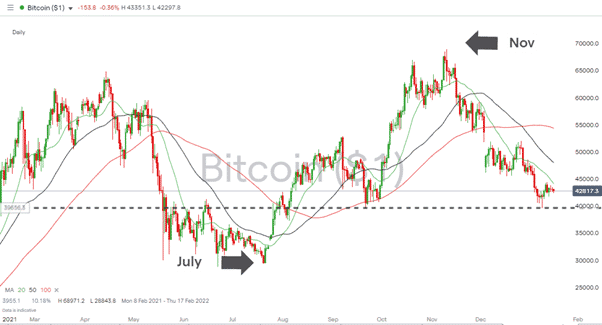
Could the worst be over for the two leading cryptos? Whilst they haven’t rebounded after the recent sell-off they do both appear to have at least found a base-level. The price of gold was almost as volatile last week and the metal posted returns of 1.6%, The relative stability of the prices of BTC and ETH suggests a new bull run is yet to be confirmed in either.
Bitcoin – 1D price chart – Price Consolidation?
Source: IG
Bitcoin Long positions
- Entry Level 1: 42,000 – Big number price support
- Entry Level 2: 39,612 – Price low of 21st September 2021
- Price Target 1: 50,000
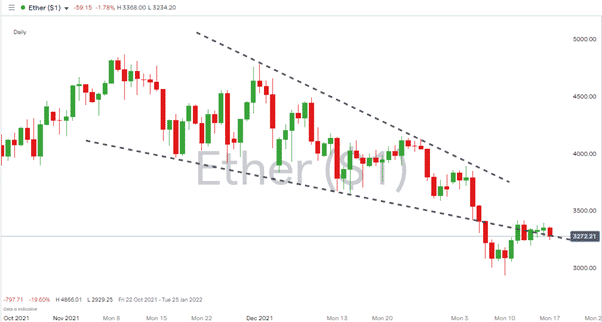
Ethereum – 1D price chart – Price Returns to Trade Inside Downwards Wedge Pattern
Source: IG
Ethereum Long positions
- Entry Level 1: 3,300 – Ethereum has recovered sufficiently to trading back inside the channel of the downward wedge pattern which dates back to Q4 2021. There is a chance that this is a temporary revisit of that price level before further weakness but will be a sign for some to buy back in.
- Price Target 1: 3,500
Risk Statement: Trading financial products carries a high risk to your capital, especially trading leverage products such as CFDs. They may not be suitable for everyone. Please make sure that you fully understand the risks. You should consider whether you can afford to take the risk of losing your money.

Forextraders' Broker of the Month
BlackBull Markets is a reliable and well-respected trading platform that provides its customers with high-quality access to a wide range of asset groups. The broker is headquartered in New Zealand which explains why it has flown under the radar for a few years but it is a great broker that is now building a global following. The BlackBull Markets site is intuitive and easy to use, making it an ideal choice for beginners.