
Our trading signal analysis is based on a comprehensive summary of market data. We use a range of metrics with weighting given to simple and exponential moving averages and key technical indicators.
We created this Weekly Tips section to share possible trade entry and exit points based on technical analysis. We also have other methods to validate our trades which we can’t publicly share that help to increase their success. All our trades include entry and at least one target price. Stop losses are applied at a reader’s discretion. Our strategies typically trade with a wide stop loss, and risk is further mitigated by trading in small sizes.
Instrument | Price | Hourly | Daily |
EUR/USD | 1.1322 | Strong Sell | Strong Sell |
GBP/USD | 1.3540 | Strong Sell | Strong Sell |
USD/JPY | 113.57 | Strong Sell | Strong Sell |
S&P 500 | 4,414 | Strong Sell | Strong Sell |
NASDAQ 100 | 14,512 | Strong Sell | Strong Sell |
FTSE100 | 7,449 | Strong Sell | Neutral |
Gold | 1,841 | Strong Buy | Strong Buy |
Crude Oil WTI | 85.24 | Buy | Strong Buy |
Bitcoin | 34,894 | Strong Sell | Strong Sell |
Ethereum | 2,379 | Strong Sell | Strong Sell |
UTC 09:52
FOCUS ON: Manufacturer Inflation Data and Upcoming Announcement From US Fed
Last week’s major sell-off in stocks has left major equity indices on the edge of posting a technical correction (a drop >10%) and led to the US dollar rallying as investors sought out the security offered by the greenback. Political tension between Russia and Ukraine supports energy prices whilst cryptos are suffering as potential interest rate hikes impact the supply of cheap money often used for more speculative trading strategies.
It’s all change in the markets so far this January and the coming week presents an opportunity to take on board key data points that might give an insight into the next market moves.
The week kicks off with Purchasing Managers Index (PMI) data from some of the world’s major economies hitting the market on Monday.
- Japan – Jibun Bank Manufacturing services PMI
- France, Germany, Eurozone – Markit PMI
- UK – Markit manufacturing services PMI
- US – Markit manufacturing services PMI
The threat to the markets posed by PMI data is that some central banks have shown little interest in aggressively reigning in retail price index rises, let alone factory-gate inflation, which lies further upstream. Any suggestion from Monday’s numbers that inflationary pressures continue to build could result in the realignment of prices in different asset groups gaining greater momentum.
Wednesday’s decision from the US Federal Reserve regarding interest rate policy is the major news event of the week. The Bank of Canada interest rate decision is due on the same day – another potential firework to throw into the mix. Few expect Jerome Powell to hit the panic button, triggering a rate hike in February, but one is firmly on the cards for March. His guidance on how many might follow later in the year can potentially send the markets in either direction.
US earnings season will also continue to play a part in stock prices. Big misses last week from Peloton and Netflix played a role in the NASDAQ 100 index posting a weekly loss of 7.87%. IBM and Philips report on Monday, Microsoft reports on Tuesday, with Tesla, Intel and AT&T all expected to report on Wednesday.
Indices
Nasdaq 100
On Monday, the Asia trading session saw the world’s most important tech stock index recover more than one per cent after last week’s battering. European investors have taken a dimmer view of the sector’s potential, and that early morning price rise looks to be forming a dead-cat-bounce pattern.
Nasdaq 100 Chart – 1hr Candles 17th – 24th January
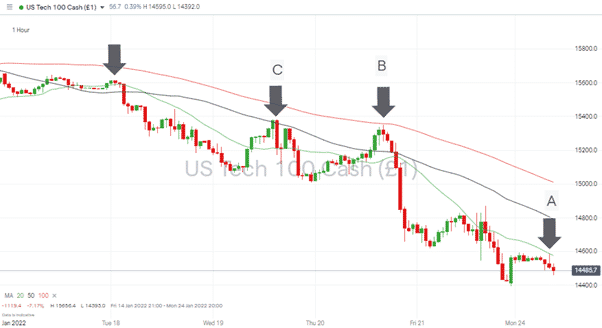
Source: IG
Short positions
- Entry Level 1: 14,576 – This entry-level uses the 20 SMA on the hourly chart. This SMA acted as the resistance which stopped further price increases in the Asia trading session of Monday (arrow A on the hourly price chart).
- Entry Level 1 & 2: 14,792 and 15,010 – This entry-level uses the 50 and 100 SMAs on the hourly chart. These acted as resistance during last week’s trading, as arrows B and C illustrate on the hourly price chart.
- Price Target 1: 13,512 – Current price level of 20 SMA on Monthly price chart
Nasdaq 100 Chart – Monthly Candles 2017 – 2022
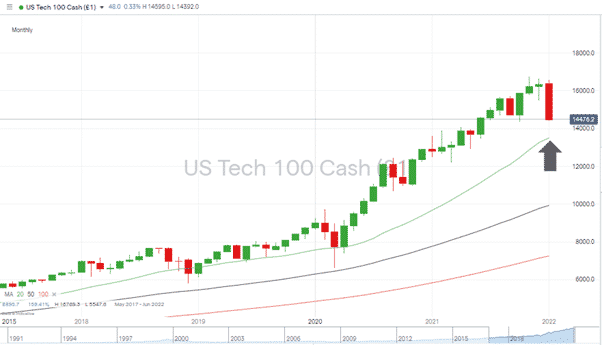
Source: IG
Long positions
- Entry Level 1: 13,512 – Current price level of 20 SMA on Monthly price chart.
Retracement trading strategies which trade against the overall direction of the trend are inherently risky, but those looking to buy this significant dip might look at some of the longer term SMA’s which could offer support. With SMAs guiding price on the way down, there is an option that one of them marks the bottom of the market.
S&P 500
S&P 500 Hourly Chart – Using SMA’s To Trade Downward Momentum
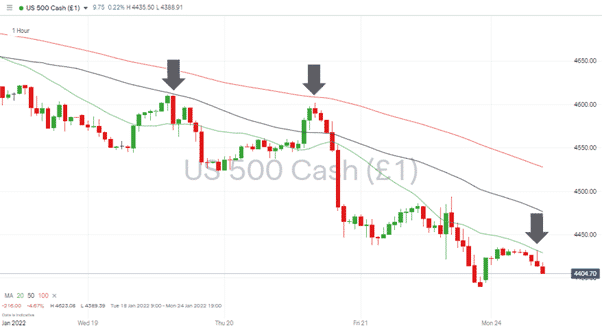
Source: IG
Short positions
- Entry Level 1: 4,429 – This entry level uses the 20 SMA on the hourly chart. As with the Nasdaq 100, the SMA acted as the resistance and stopped further price increases in the Asia trading session of Monday.
- Entry Level 1 & 2: 4,473 and 4,525 – This entry-level uses the 50 and 100 SMAs on the hourly chart.
- Price Target 1: 4,357 – Current price level of 50 SMA on Weekly price chart
Long positions
- Entry Level 1: 4,357 – Current price level of 50 SMA on Weekly price chart. A further fall in value of approximately 1.14% would bring the S&P 500 index to the current level of the critical Weekly SMA support level,
FTSE 100
The UK’s benchmark index held up better than its US peers during the sell-off. This reflects the stocks it holds having generally lower price volatility and the FTSE lagging the S&P and Nasdaq 100 during their bull-runs of the last 12 months.
FTSE 100 Daily Chart – December 2021 – January 2022
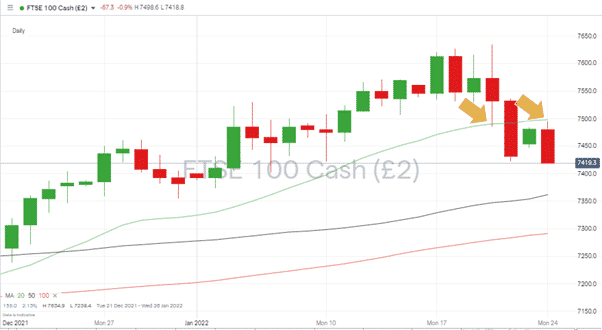
Source: IG
Long positions
- Entry Level 1: 7,497 Any bounce in the value of the FTSE would need to clear the 20 SMA of the Daily price chart. That level acted as support on Thursday 20th January and resistance on Monday 24th January. Patience and waiting for a breakout pattern to form to the upside could limit losses for those looking to buy the current dip.
- Price Target 1: 7,634 – January 2022 and year-to-date price high
- Stop Loss: 7,350 – below the 50 SMA on the Daily price chart and the swing-low of 31st December.
Forex
GBPUSD
Cable has broken out of its downward channel with some considerable momentum. Short-term weakness and a revisit to the upper trend line of the previous trading range can’t be discounted but would offer an opportunity for GBP bulls to reload on positions.
GBPUSD – Daily chart – Failed breakout of long-term downwards price channel
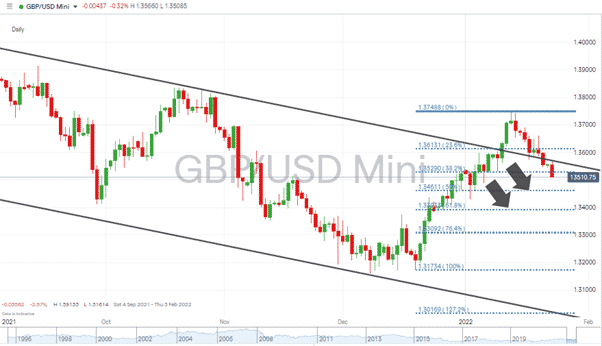
Source: IG
Long positions
- Entry Level 1: 1.34611 – Level of 50% Fibonacci Retracement of the bull-run from 20th December 2021 to 13th January 2022
- Price Target 1: 1.355 – Using the upper trend line, which dates back to May 2021.
- Stop Losses: 1.335 – Support can be expected at the round number / psychologically important price level of 1.340, which is also the region of the 61.8% Fib Retracement level (1.339)
EURUSD
Dollar strength has brought EURUSD back into the wedge price pattern, but the euro has found some strength since testing the supporting trend line of that wedge. A breakout to either side could be on the cards, but with the US Fed speaking on Wednesday, it could be later in the week before the direction of the move is confirmed.
EURUSD – 1D chart – Failed Break Out Of Sideways Wedge Pattern
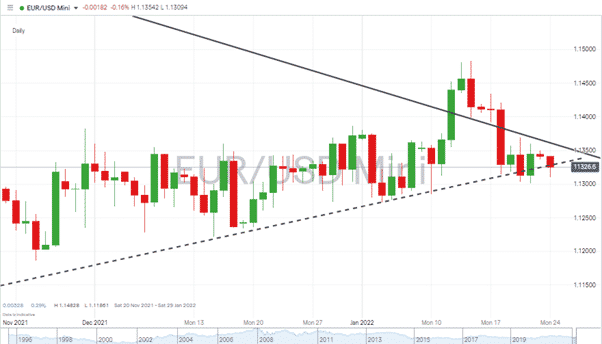
Source: IG
Short positions
- Entry Level 1: 1.1329 – This price level marks the lower trend line of the channel, which dates back to November 2021. A break to the downside would mark a good trade entry point for those who expect the dollar’s strong run to continue.
- Price Target 1: 1.130 – Important round number price level which offered support on Thursday 20th and Friday 31st January.
- Stop Losses: >1.1350 – EURUSD tested this psychologically important price level last week. Intraday trading saw it print prices above it at times, but the fact it failed to close above 1.1350 suggests the path of least resistance remains downwards.
Crude Oil (WTI)
Oil had a good week and was up +2%, thanks to geopolitical tensions relating to Russian gas and oil supplies. It has failed to break above the high of $85.06 printed in October of last year suggesting it could give up some ground or consolidate at this higher level. A flare-up on the Russia-Ukraine border is the most likely catalyst for further price rises from here.
Crude Oil (WTI) Daily Chart – Finding Resistance at Top of Trading Channel
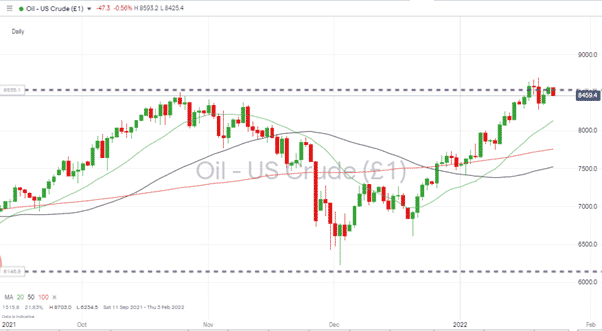
Source: IG
Long positions
- Entry Level 1: 85.06 Price high of October 2021, and also the 24-month price high. Breakout strategy supported by fundamental economic factors.
- Stop Loss: < 82.72 – Lowest price recorded on Thursday 20th January.
Crypto – Bitcoin & Ethereum
The threat of four interest rate rises in the US through the course of 2022 has deflated the crypto markets in a way that regulators and critics of blockchain currencies have failed to do. Bitcoin fell in value by +18% over last week, and Ethereum’s price crash was even more spectacular, with that coin giving up more than 27%.
Bitcoin – 1D price chart – Major Swing Low Coming Into View
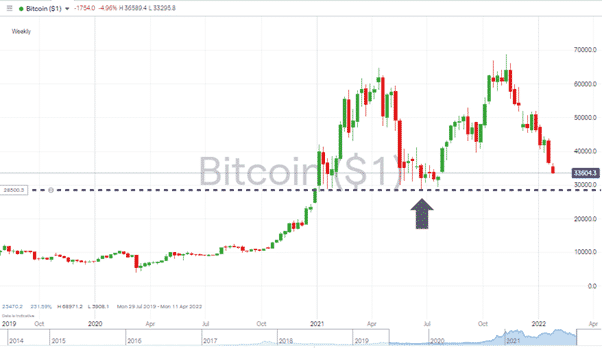
Source: IG
Bitcoin Long positions
Entry Level 1: 28,843 – There looks little chance of Bitcoin not testing $30,000 or the swing low of 21st June 2021. A break of that price level would represent a bearish price pattern forming with the peaks of April and November 2021 forming an extremely bearish double-top formation.
Ethereum – 1D price chart – Bearish Price Action Continues
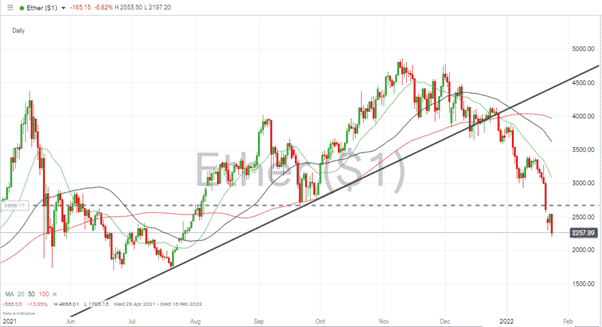
Source: IG
Ethereum Long positions
- Entry Level 1: 2,000 – Ethereum’s sell-off continues to gain momentum, and any long positions run the risk of falling into the category of catching a falling knife. Round number price support in the region of 2,000 looks the best hope for fans of ETH.
- Price Target 1: 2,560 – Price low of Friday 21st January. Top of the price gap recorded between the Friday and Saturday trading sessions.
Risk Statement: Trading financial products carry a high risk to your capital, especially trading leverage products such as CFDs. They may not be suitable for everyone. Please make sure that you fully understand the risks. You should consider whether you can afford to take the risk of losing your money.

Forextraders' Broker of the Month
BlackBull Markets is a reliable and well-respected trading platform that provides its customers with high-quality access to a wide range of asset groups. The broker is headquartered in New Zealand which explains why it has flown under the radar for a few years but it is a great broker that is now building a global following. The BlackBull Markets site is intuitive and easy to use, making it an ideal choice for beginners.