
Our trading signal analysis is based on a comprehensive summary of market data. We use a range of metrics with weighting given to simple and exponential moving averages and key technical indicators.
We created this Weekly Tips section to share possible trade entry and exit points based on technical analysis. We also have other methods to validate our trades which we can’t publicly share that help to increase their success. All our trades include entry and at least one target price. Stop losses are applied at the reader’s discretion. Our strategies typically trade with a wide stop loss, and risk is further mitigated by trading in small sizes.
Instrument | Price | Hourly | Daily |
EUR/USD | 1.1344 | Strong Sell | Neutral |
GBP/USD | 1.3535 | Strong Sell | Neutral |
USD/JPY | 115.40 | Strong Sell | Strong Buy |
S&P 500 | 4,421 | Strong Sell | Strong Sell |
NASDAQ 100 | 14,254 | Strong Sell | Strong Sell |
FTSE100 | 7,588 | Strong Buy | Strong Buy |
Gold | 1,852 | Buy | Strong Buy |
Crude Oil WTI | 92.76 | Strong Buy | Strong Buy |
Bitcoin | 42,153 | Strong Sell | Sell |
Ethereum | 2,867 | Strong Sell | Strong Sell |
UTC 08:25
FOCUS ON: Risk Aversion
Geopolitical events and the threat of war on the Ukraine-Russia border has caused the move out of risk-on assets to take on a different feel. Since the turn of the year, a debate about valuations has been fuelled by higher inflation and interest rates being factored into pricing models. The broad move down was interspersed with periods where dip-buyers stepped in to cause upward retracements in price.
Friday’s sell-off was different. After the close of European exchanges, US traders and investors bailed out of flagship equity indices. Price just bled out, and the S&P 500 and NASDAQ 100 indices closed 2% and 2.8% down, respectively, on Friday. The 10 min price chart for the NASDAQ 100 index illustrated the lack of any counterpunches from the perma-bulls.
NASDAQ 100 10min Price Chart – Intraday – US Trading Session 11th February 2022 – Bleeding Out
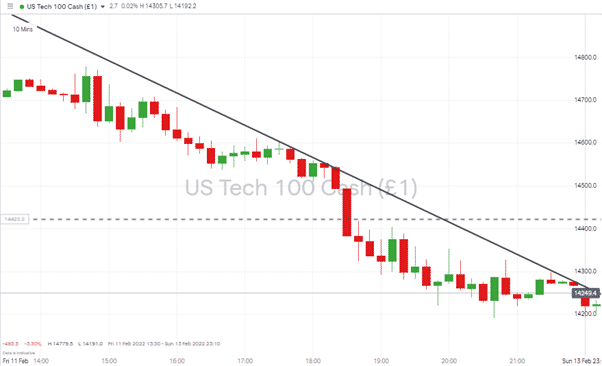
Source: IG
This looks more like a reaction to the conflict brewing in Eastern Europe than a considered reappraisal stock valuation and the long-term direction of the world economy. A thought backed up by the traditional asset of last resort, gold, putting on more than 2% in value in one week.
Indices
NASDAQ 100
Year-end 2021 earnings updates from many of the big hitters in the tech sector have come and gone, and the net result is that the index is 12.7% down on a year-to-date basis. With a technical correction confirmed, political tensions threatening supply chains, and discretional consumer income threatened, it appears the path of least resistance is currently downward.
The trading sessions of Thursday and Friday were associated with an increase in volumes and resulted in two big red candles as wide-spread selling pressure built up momentum.
Nasdaq 100 Chart – 1Day Candles Up to 2022 year-to-date – Double Top?
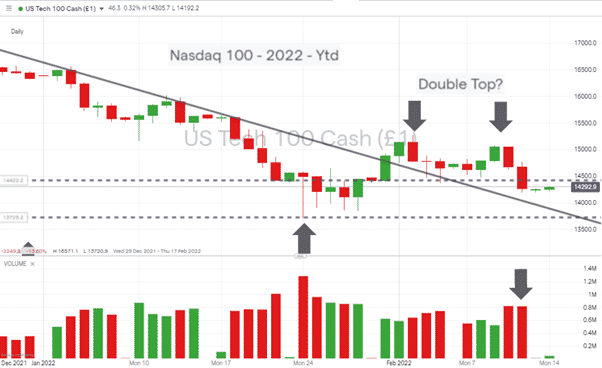
Source: IG
Short positions
- Entry Level 1: 14,375 – The potential double top on the Daily price chart was boosted by Friday’s break of the 14,375-price low of the 4th of February. Those looking to bet against the index could use any short-term price strength to work into short positions at that level.
- Price Target 1: 13,800 – 14,000 – Region of downward trend line dating from the start of the year.
- Price Target 2: 13,720 – year-to-date price low of 24th January.
- Stop Loss: > 15,000 – Price level of double top and psychologically important ‘round number.’
S&P 500
It wasn’t just tech-stocks that gave up ground last week. The greater weighting that the S&P 500 has to ‘traditional’ industries left that index exposed to the risk of higher energy prices and supply chain concerns.
The price low of 4,221 printed on 24th January almost clipped the 23.6% Fibonacci retracement of the March 2020 bull run, and the continuing sell-off is bringing that critical price level into focus once more.
S&P 500 Daily Price Chart – 2020 – 2022 – Fib Retracement
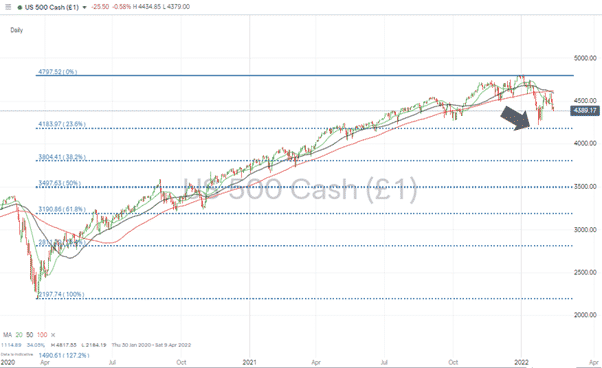
Source: IG
S&P 500 Daily Price Chart – 2021 – 2022 – Double-Top?
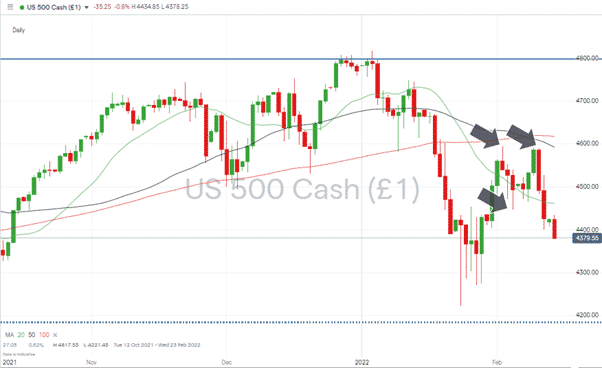
Source: IG
Short positions
- Entry Level 1: 4,447 – The potential double top formed on the 2nd and 9th February came into play when price broke through the 4,447-price low of 4th February. That price support has now switched to become a resistance level and marks an entry point for those looking to sell into any short-term price rallies.
- Price Target 1: 4,200 – Region of price low of 24th January and 23.6% Fib retracement support level.
- Stop Loss 1: > 4,600 – Price level of double top and ‘round number’ resistance.
- Stop Loss 2: >4,393 – Region of Weekly 50 SMA. Short positions which work as planned can be protected by shifting the stop-loss level down to this moving average and ensuring that some profits are locked in should the market rebound.
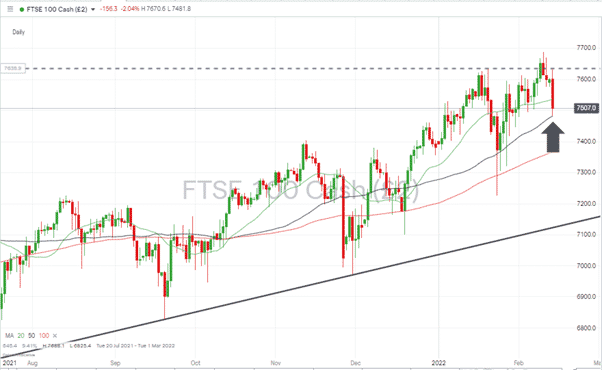
FTSE 100
The FTSE 100’s weighting towards energy stocks helped that index resist the worst of last week’s sell-off. Whilst the Nasdaq 100 lost close to 3% over last week, the UK’s flagship index appreciated in value by close to 0.50%.
That strength could be tested by an escalation of the conflict between Ukraine and Russia as higher energy costs would have a considerable impact on the +80% of the stocks in the FTSE that are not in the oil and gas sector. They will be facing increasing energy costs.
FTSE 100 Daily Price Chart – Moving Average Coming Into Play
Source: IG
Short positions
- Entry Level 1: 7,537 – Region of the 20 SMA on the Daily price chart.
- Price Target 1: 7,482 – Region of the 50 SMA on the Daily price chart and a support level that has already manufactured one rebound during the recent sell-off.
- Stop Loss: 7,688 – year-to-date price high of 10th February.
Forex
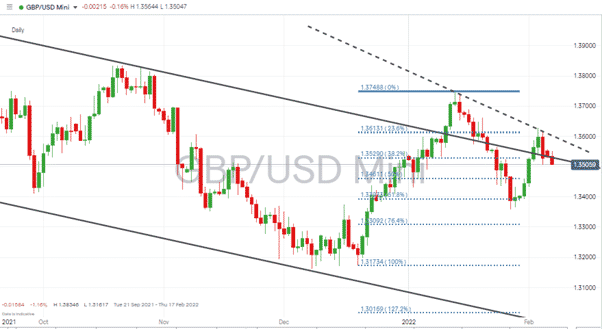
GBPUSD
Central banks in the UK and US responded to surprisingly high inflation data by offering more hawkish guidance to the markets. The consensus has resulted in a sideways price movement with intraday spikes and troughs in the price of GBPUSD as each country takes its turn to ratchet up its approach to inflation.
This week, data out in the UK includes the United Kingdom Consumer Price Index (CPI) on Wednesday and month-to-month United Kingdom Retail Sales on Friday.
GBPUSD – Daily chart – Price trading along long-term downwards price resistance
Source: IG
Long positions
- Entry Level 1: 1.3490 – Bottom of sideways trading range marked by price low of 7th February.
- Price Target 1: 1.3564 – Top end of sideways trading range marked by price high of 11th February.
- Stop Losses: 1.3477 – Region of 100 SMA on Daily price chart.
Short positions
- Entry Level 1: 1.3564 – Top end of sideways trading range marked by price high of 11th February.
- Price Target 1: 1.349 – Bottom of sideways trading range marked by price low of 7th February.
- Stop Losses: 1.3740 – Year-to-date price high of 13th January.
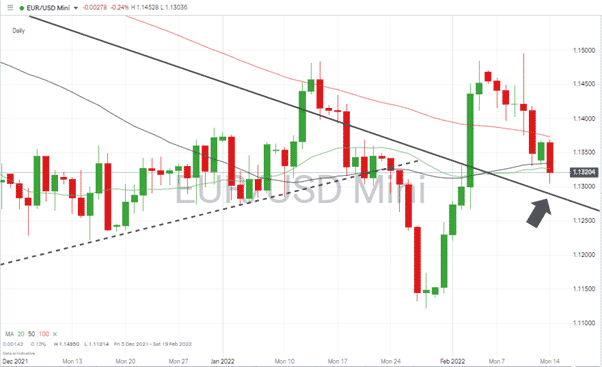
EURUSD
It’s a relatively quiet week in terms of eurozone announcements, but data points to look out for that could influence the price of EURUSD are:
- Tuesday: Germany ZEW Economic Sentiment
- Wednesday: FOMC Meeting Minutes.
EURUSD – Daily chart – Retreat to the upper trend line
Source: IG
Long positions
- Entry Level 1: 1.129 – Using the upper trend line of the long-term downwards trading channel as a support level. Look out for an uptick in trade volumes at the time of any bounce, which would offer secondary confirmation that the breakout of 3rd February still has legs.
- Target price: 1.1495 – Price high of 10th February. This price level marks peak euro strength during last week and is the year-to-date high as well.
- Stop Losses: 1.1264 – 61.8% Fib retracement of the price rise between 28th January and 10th Feb. A key support if that rally and breakout pattern is going to hold. A break of this level would point towards a return to the long-term downward price channel.
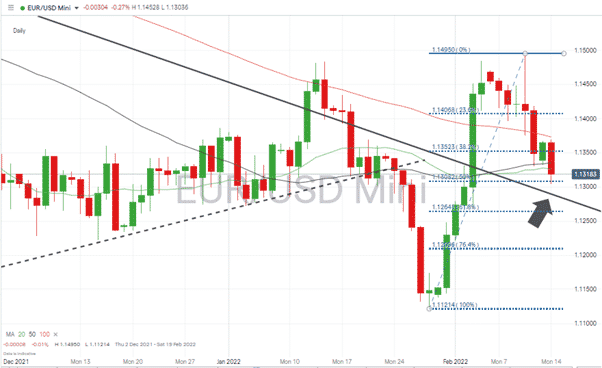
EURUSD – Daily chart – Fib Retracement coming into play
Source: IG
Short positions
- Entry Level 1: 1.132 – 1.133 – Region of 20 and 50 SMA on the Daily price chart.
- Target price: 1.129 – Region of upper trend line of the long-term downwards trading channel.
- Stop Losses: > 1.1495 – Year-to-date price high of 10th February.
Gold
The world’s asset of last resort has come into favour due to the threat of Russia invading Ukraine. The tensions have resulted in the metal breaking out of a sideways wedge pattern dating back to August 2020.
Gold – Daily price chart – Breakout of Multi-year Wedge Pattern
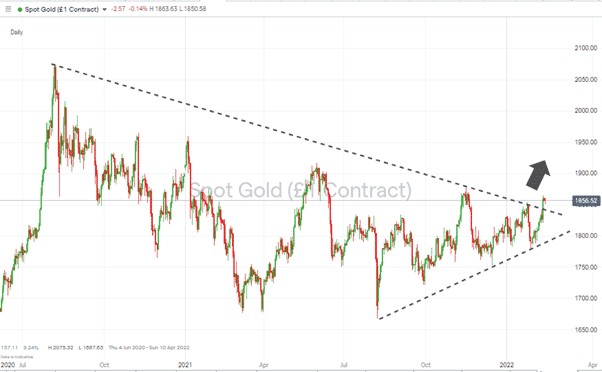
Long positions
- Entry Level: 1840 – Any retreat to the upper trend line of the wedge pattern could offer a second opportunity for those looking to trade a breakout strategy.
- Price Target 1: 2000 – psychologically important price level.
- Price Target 1: 2073 – Multi-year price high of August 2020.
- Stop Losses 1: < 1800 – Region of upper trend line of the wedge pattern.
Crypto – Bitcoin & Ethereum
Bitcoin reached almost as high as $46,000 during the last week’s trading. It closed the week down 1.10% at $42,570. The fall in value is a relatively small one for the usually highly volatile crypto markets and offers hope to those who believe that BTC is consolidating at current levels. On the other hand, Ether saw its price slide by almost 7%, suggesting coins seen as a means of transaction rather than a store of wealth could still suffer further weakness.
Bitcoin – Daily price chart – Breakout Pattern Still Holds
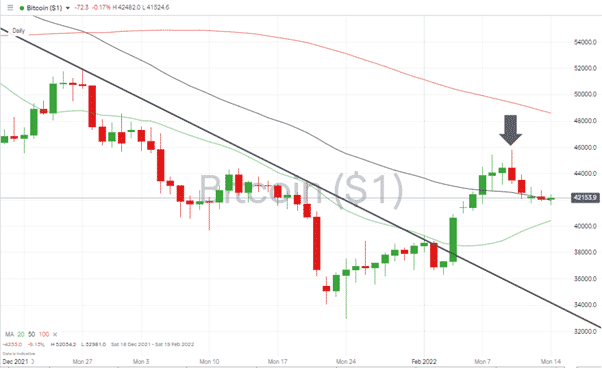
Source: IG
Bitcoin Long positions
- Entry Level: 41,966 – Bitcoin is sitting on the 50 SMA on the Daily price chart. That key metric held since Thursday 10th February offers an entry-level for those following the strategy based on the breakout of the downwards price channel.
- Price Target 1: 50,000
- Stop Losses 1: < 32,981 Current region of the upper trend line of the long term downwards price channel and year-to-date price low of 24th January.
Ethereum – 1D price chart – Short-term Trend Line Breaks But Long-term Trend Line Holds
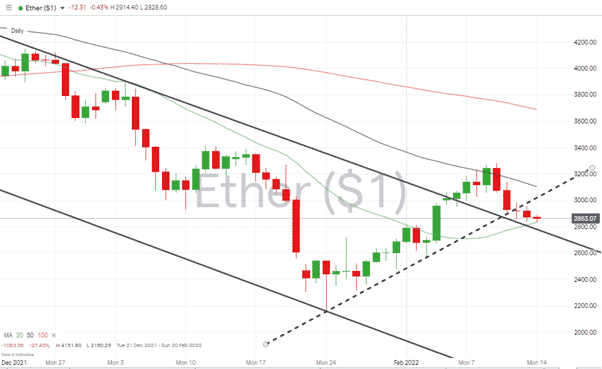
Source: IG
Ethereum Long positions
- Entry Level: 2,800 – Using psychologically important round number support and the 20 SMA on the Daily price chart as an entry point.
- Price Target 1: 3,272 – Price high of Wednesday 9th February.
- Stop Losses: < 2,750 Region of downwards trend line. A return to trading below this line would signal the breakout of 5th February as having failed to materialise.
Risk Statement: Trading financial products carries a high risk to your capital, especially trading leverage products such as CFDs. They may not be suitable for everyone. Please make sure that you fully understand the risks. You should consider whether you can afford to take the risk of losing your money.

Forextraders' Broker of the Month
BlackBull Markets is a reliable and well-respected trading platform that provides its customers with high-quality access to a wide range of asset groups. The broker is headquartered in New Zealand which explains why it has flown under the radar for a few years but it is a great broker that is now building a global following. The BlackBull Markets site is intuitive and easy to use, making it an ideal choice for beginners.