
Instrument | Price | Hourly | Daily |
EUR/USD | 1.0754 | Strong Buy | Strong Buy |
GBP/USD | 1.2629 | Neutral | Strong Buy |
USD/JPY | 127.25 | Strong Buy | Neutral |
S&P 500 | 4,191 | Strong Buy | Buy |
NASDAQ 100 | 12,841 | Strong Buy | Buy |
FTSE100 | 7,613 | Strong Buy | Strong Buy |
Gold | 1,862 | Strong Buy | Strong Buy |
Crude Oil WTI | 114.41 | Strong Buy | Strong Buy |
Bitcoin | 30,553 | Strong Buy | Neutral |
Ethereum | 1,900 | Strong Buy | Strong Sell |
UTC 09:12
Our trading signal analysis is based on a comprehensive summary of market data. We use a range of metrics with weighting given to simple and exponential moving averages and key technical indicators.
We created this Weekly Tips section to share possible trade entry and exit points based on our technical analysis. We also have other methods to validate our trades which we can’t publicly share that help to increase their success. All our trades include entry and at least one target price. Stop losses are applied at the reader’s discretion. Our strategies typically trade with a wide stop loss, and risk is further mitigated by trading in small size.
The FTSE 100 equity index, the euro-dollar currency pair, and crypto market indicators are all pointing towards short-term strength and long-term weakness. Trading decisions need to be made with holding periods in mind and choppy market conditions could prevail in the run up to the Fed’s big announcement.
FOCUS ON: How Far Can The Rally Go?
The bounce which ‘had to come’ finally materialised at the end of last week. It’s taken some weeks to appear, and impatience from those who looked to pick the bottom of the market would have been a losing trade for more than a month. The question being asked is how much momentum the current rally has?
A rebound was identified in the report entitled “Potential For A Rally?” but even that included caveats that there was still room for downward price moves. Risk on assets isn’t guaranteed to continue rising from here. The trading activity behind the current move is as likely to be driven by the closing out of short trades by big systematic CTA funds. That process of locking in profits on bearish strategies and moving to a neutral position is less of a vote of confidence than outright buys. The economic and political landscape still holds plenty of risks and there are still questions about how central banks will approach the subject of inflation.
S&P 500 Index Price Chart – 1Day Candles – 2021 – 2022 -Trendline Breakout?
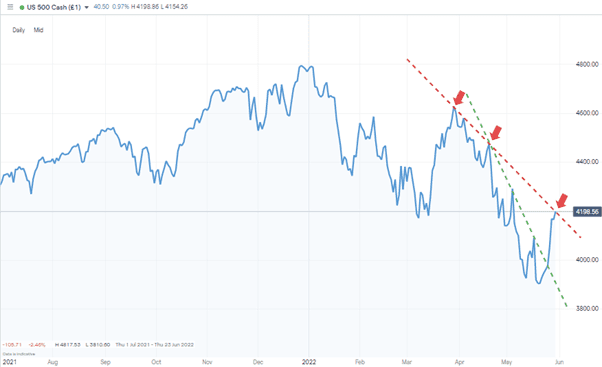
Source: IG
The big news event of the coming week is the release of the Non-Farm Payrolls data on Friday. That traditionally sets the tone for the markets and this month hits the news wires on a day when trading volumes can be expected to be down and therefore price more sensitive to the details of the report. The foreshortened week comes about because the London markets will be closed on Thursday 2nd and Friday 3rd June and the US exchanges closed on Monday 30th May. A period of relative quiet could favour the bottom-fishers as unattended equity markets do tend to drift upwards.
Indices
Nasdaq 100
The high beta nature of tech stocks means the Nasdaq 100 index often overshoots to a greater extent than other indices. The hammering the Nasdaq 100 index suffered over the last couple of months meant that Friday’s relief rally resulted in a 3.59% daily gain.
NASDAQ 100 Chart – 1Day Candles – Breakout
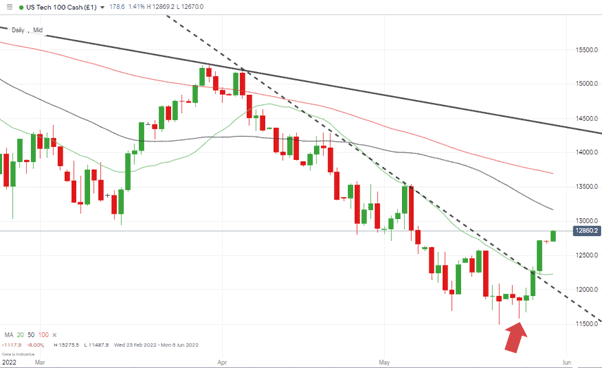
Source: IG
Those who think the tide has really turned will have identified the Nasdaq 100 index as the market with the greatest potential. Whereas the above Daily Price Chart of the S&P 500 index shows price approaching a key resistance trend line the Nasdaq 100 has a lot of head room before it meets its next downward trendline. The Nasdaq index itself is closed for the Memorial Day holiday on Monday but futures in the index have opened the week strongly. During the opening hours of European trading it was in a positive territory, in the region of 12,850 which is still some way below the trend line resistance which currently sits in the region of 14,100.
NASDAQ 100 Chart – 1Day Candles –Trendline 1 and Trendline 2
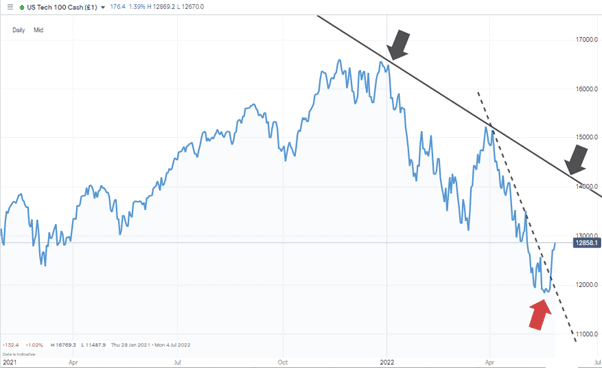
Source: IG
Long positions
- Entry Level 1: 12,200 – Region of the 20 SMA on the Daily Price Chart. Buying into any short term pull backs.
- Price Target 1: 13,554 – Price high of 4th May 2022.
- Price Target 2: 13,693 – Region of the 100 SMA on the Daily Price Chart.
- Stop Loss: < 11,487 – Intraday price low of 20th May 2022. Year to date low and below the downward trendline which dates back to 5th April 2022.
FTSE 100
Technical indicators for the FTSE 100 are ‘Strong Buy’ on an hourly and daily timeframe. This ties in with the index holding a large number of big banks and gas and oil firms which could offer better protection from inflationary pressures than the growth stocks found in the Nasdaq.
FTSE 100 Daily Price Chart – Price following the 7th March trendline
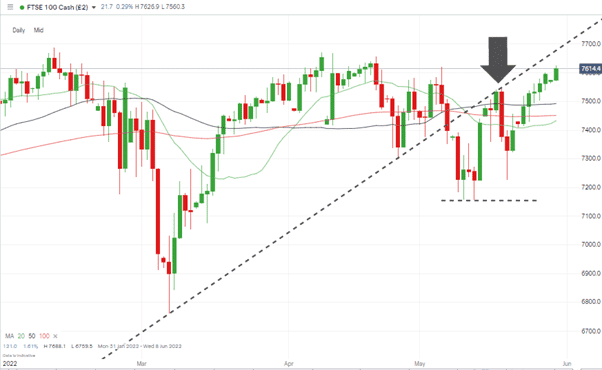
Source: IG
Long positions
- Entry Level 1: 7,492 – Region of the 50 SMA on the Daily Price Chart.
- Price Target 1: 7,486 – Region of the 50 SMA on the Daily Price Chart.
- Price Target 1: 7,688 – Price high of Friday 10th February 2022. Region of trendline which offered support but now acts as resistance.
- Stop Loss: < 7,433 – Below 20, 50, and 100 SMA on Daily Price Chart.
Short positions
- Entry Level 1: 7,655 – Region of the trendline resistance. Price hasn’t traded above the trendline since 6th May 2022.
- Price Target 1: 7,486 – Region of the 50 SMA on the Daily Price Chart.
- Stop Loss: > 7,688 – Price high of Friday 10th February 2022. Year to date high.
Oil
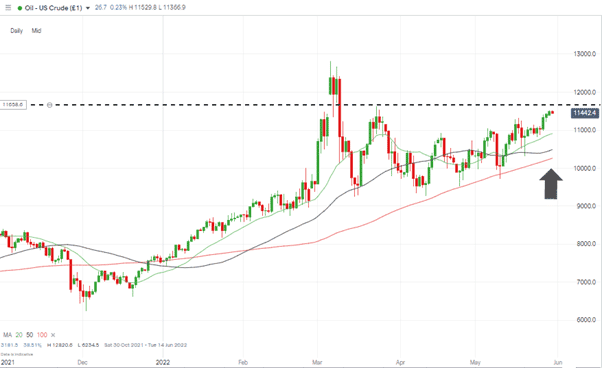
Oils upwards ascent continues, and price hasn’t closed below the 100 SMA on the Daily Price Chart since 6th January 2022. Strategies which have relied on buying into moments of price weakness have worked well for weeks and months, but some caution is required later in the week.
On Thursday 2nd June the OPEC+ meeting takes place. This round of talks from leaders of the oil industry will include representatives from Russia. Given the uncertainty surrounding geopolitical events, there is a risk of a surprise news announcement jolting price from its current upwards price channel.”
US Crude Oil – Daily Price Chart – Range-bound Trading
Source: IG
Long positions
- Entry Level 1: 109.07 – Region of the 20 SMA on the Daily Price Chart.
- Price Target 1: 116.31 – Price high of 23rd March 2022.
- Stop Loss: < 102.33 – Region of the 100 SMA on the Daily Price Chart
Short positions
- Entry Level 1: 116.31 – Price high of 23rd March 2022.
- Price Target 1: 109.07 – Region of the 20 SMA on the Daily Price Chart. Also, just below the psychologically important $100 per barrel price point.
- Stop Losses: > 128.20 – Year to date price high recorded on 6th March 2022.
Forex
GBPUSD
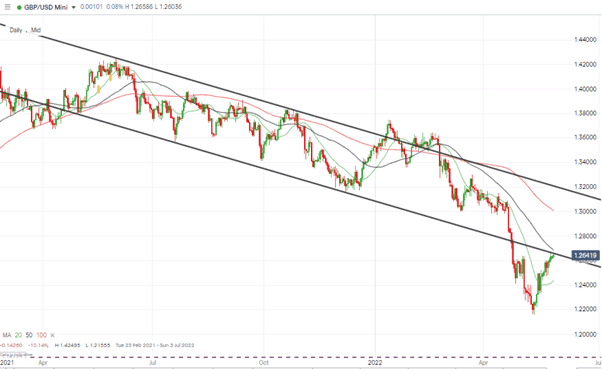
What looked like a short-term relief rally which started on 13th May 2022 has morphed into a sustained upwards price move. The multi-week rally has surprised many given the relative strength of the US and UK economies and long-term prospects for GBPUSD remain bleak. Price is also approaching two key resistance levels. The first is the trendline which dates from 18th April 2021 and the second is the 50 SMA on the Daily Price Chart.
GBPUSD – Daily Price Chart – Relief Rally
Source: IG
Short positions
- Entry Level 1: 1.2700 – The Trading Ideas report of 23rd May identified this price level as the one at which to start considering selling GBPUSD. Short positions entered into the area of 1.2700 have allowed for the bulls to run out of steam and marks the region of the 50 SMA on the Daily Price Chart and the multi-month trend line.
- Price Target 1: 1.2424 – Region of the 20 SMA on the Daily Price Chart.
- Stop Losses: > 1.3014 – Round number resistance level which is also in the region of the 100 SMA on the Daily Price Chart.
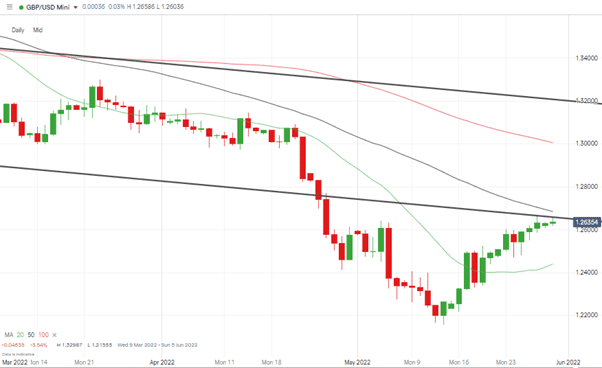
GBPUSD – Daily Price Chart – 20 SMA & Trendline Resistance
Source: IG
Long positions
- Entry Level 1: 1.2700 – A break above the downwards trend line which dates back to April 2021 would signify a significant shift in sentiment for the currency pair.
- Price Target 1: 1.30 – Region of the 100 SMA on the Daily Price Chart and psychologically important price level.
- Stop Losses: < 1.2440 – Region of the 20 SMA on the Daily Price Chart.
Crypto – Bitcoin & Ethereum
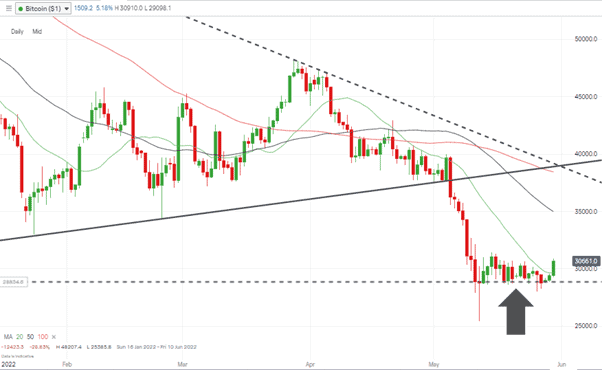
The major coins of the crypto sector have over the last week experienced a price divergence. Bitcoin’s status as the preferred coin for those looking to use crypto as a store of wealth has helped it stabilise above the crucial $30,000 price level. BTC has started the week strongly so those looking to buy in can either trade a breakout strategy and enter into a position at current levels or hope for a pull back to the 20 SMA on the Daily Price Chart.
Ethereum’s improved functionality and ability to be used as an effective means of exchange have been less attractive to investors. ETH has fallen below the important $2,000 price level and started the week trying to hold ground above $1,900.
Bitcoin – Daily Price Chart – Consolidating
Source: IG
Bitcoin Long positions
- Entry Level 1: 29,627 – Region of 20 SMA on the Daily Price Chart.
- Price Target 1: 34,989 – Region of 20 SMA on Daily Price Chart and psychologically important $35k price level.
- Price Target 2: 38,800 – Region of the 100 SMA on the Daily Price Chart and supporting trendline dating back to 24th January 2022.
- Stop Losses: < 25,385 – Below price low of Friday 13th May 2022.
Ethereum – Daily price chart – Trading below key $2,000 price level
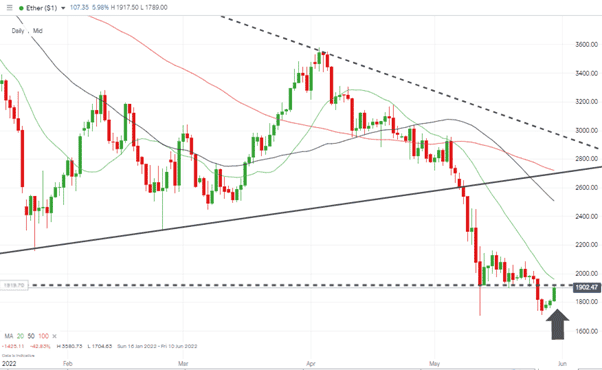
Source: IG
Given the broader move back into risk assets a bounce in the price of ETH can’t be discounted but the coin has started the week below two key resistance levels.
Ethereum Long positions
- Entry Level 1: 2,000 – Round number support which has come into play over the last two weeks. Using price action above this level as a sign that upwards momentum is building.
- Price Target 1: 2,508 – Region of the 50 SMA on the Daily Price Chart.
- Price Target 2: 2,722 – Region of the lower trend line of the wedge pattern and the 100 SMA on the Daily Price Chart.
- Stop Losses: < 1,711 – Year-to-date low of 27th May 2022.
Risk Statement: Trading financial products carries a high risk to your capital, especially trading leverage products such as CFDs. They may not be suitable for everyone. Please make sure that you fully understand the risks. You should consider whether you can afford to take the risk of losing your money.

Forextraders' Broker of the Month
BlackBull Markets is a reliable and well-respected trading platform that provides its customers with high-quality access to a wide range of asset groups. The broker is headquartered in New Zealand which explains why it has flown under the radar for a few years but it is a great broker that is now building a global following. The BlackBull Markets site is intuitive and easy to use, making it an ideal choice for beginners.