
Instrument | Price | Hourly | Daily |
EUR/USD | 1.0754 | Strong Buy | Strong Buy |
GBP/USD | 1.2629 | Neutral | Strong Buy |
USD/JPY | 127.25 | Strong Buy | Neutral |
S&P 500 | 4,191 | Strong Buy | Buy |
NASDAQ 100 | 12,841 | Strong Buy | Buy |
FTSE100 | 7,613 | Strong Buy | Strong Buy |
Gold | 1,862 | Strong Buy | Strong Buy |
Crude Oil WTI | 114.41 | Strong Buy | Strong Buy |
Bitcoin | 30,553 | Strong Buy | Neutral |
Ethereum | 1,900 | Strong Buy | Strong Sell |
UTC 09:12
Our trading signal analysis is based on a comprehensive summary of market data. We use a range of metrics with weighting given to simple and exponential moving averages and key technical indicators.
We created this Weekly Tips section to share possible trade entry and exit points based on our technical analysis. We also have other methods to validate our trades which we can’t publicly share that help to increase their success. All our trades include entry and at least one target price. Stop losses are applied at the reader’s discretion. Our strategies typically trade with a wide stop loss, and risk is further mitigated by trading in small quantities.
The FTSE 100 equity index, the euro-dollar currency pair, and crypto market indicators point towards short-term strength and long-term weakness. Trading decisions need to be made with holding periods in mind, and choppy market conditions could prevail in the run-up to the Fed’s big announcement.
FOCUS ON: Stock Markets In Bounce Mode But Watch Out For Dollar Strength
The short trading week of 30th May was marked by range-bound trading across most markets, but price moves and economic data releases did offer some signposts on the next direction for the markets.
Investors continued to head to the security offered by the US dollar, and the greenback gained ground against EUR, GBP, and most notably, the Japanese yen. The +2% rally in USDJPY was the significant price move of the week in terms of forex markets.
Stock indices were pretty flat on the week, but the upside of the trading range was tested on several occasions suggesting that the path of least resistance is currently upward. How far that upward movement goes is still the question. There is plenty of headroom for stocks before they reach the upper end of the long-term downward price channel. With a relatively limited amount of economic data due to be released, there are few data-driven obstacles to them continuing to operate in bounce mode through the coming week.
Nasdaq 100 Index Price Chart – 1 Day Candles – 2021 – 2022 – Mid-range Price Action
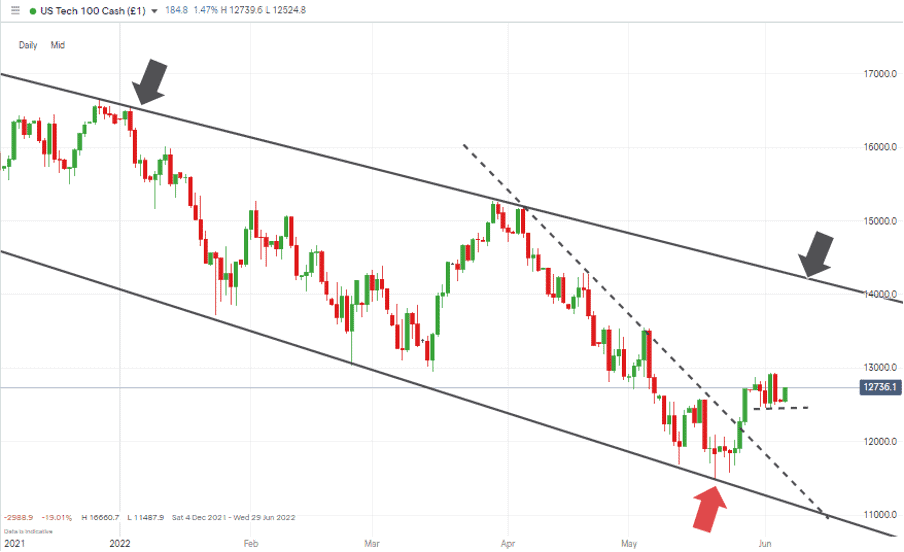
Source: IG
Major European exchanges are closed on 6th June, following the national holidays in the US and UK last week. Whilst trading desks are going through periods of occasionally being unmanned, government officials were busy releasing key data reports last week.
The US Non-Farm Payroll report of Friday 3rd June noted that employment was up 390,000 in May, beating the consensus estimate of 325,000. Total unemployment remained unchanged, and the average hourly earnings rose 0.3%, lower than the forecast of 0.4%. That ten basis point difference in the hourly earnings number suggests that wage-driven inflation has not yet filtered into the system. That offers hope to those who think fears of inflation might be overplayed.
Indices
NASDAQ 100
The weak underlying economic situation may be bad news for tech stocks in the long term, but short-term price strength has opened the door to the Nasdaq 100 attempting to test the 14,000-price level. That psychologically significant round number currently sits in the region of the upper end of the multi-month price channel.
An RSI of 52 on the Daily Price Chart marks the index out as being some way from being overbought. With the coming week being light in terms of news announcements, the lack of surprises means this could be a week for the bulls rather than the bears.
NASDAQ 100 Chart – 1 Day Candles – RSI mid-range at 52
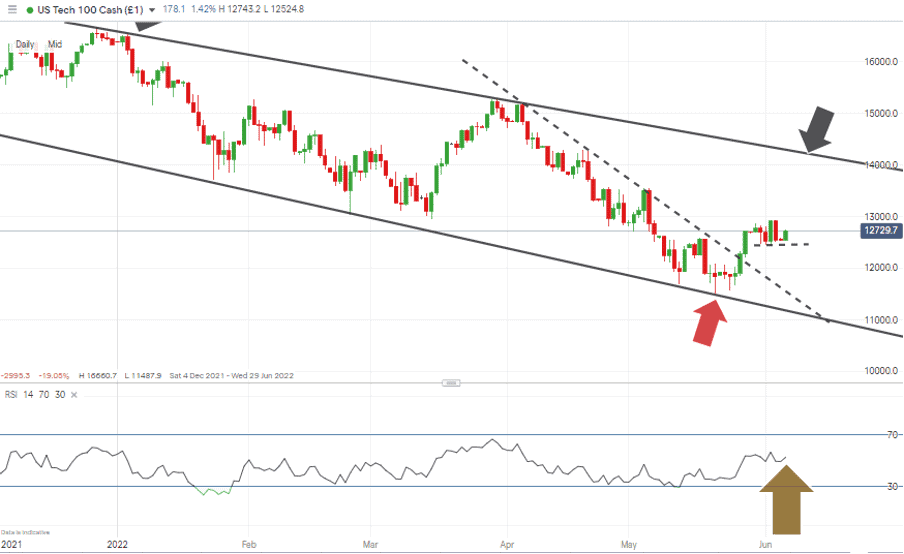
Source: IG
The 20 and 50 SMAs on the Daily Price Chart need to be monitored. Last week’s price moves were made with these two key metrics in mind, and a break of either of them would signal which way the market is heading.
NASDAQ 100 Chart – 1 Day Candles –SMA’s in Play
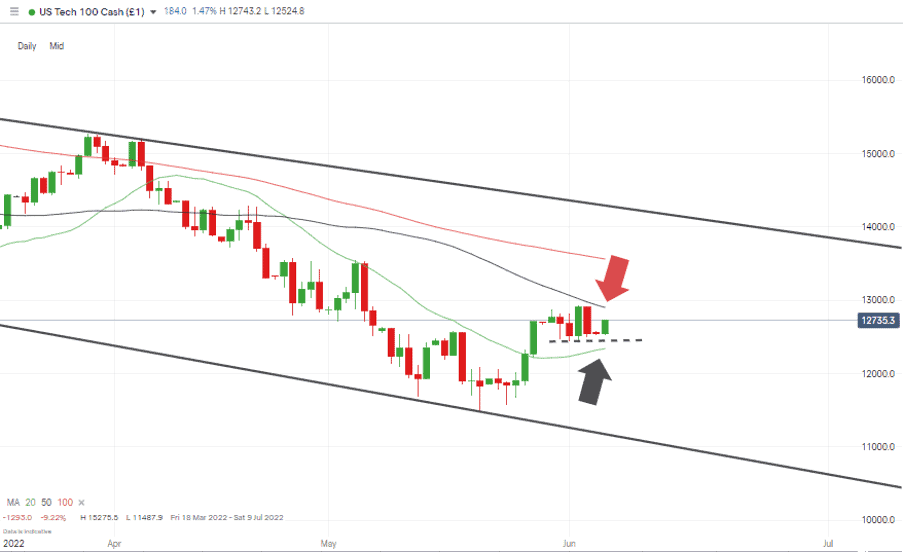
Source: IG
Long positions
- Entry Level 1: 12,345 – Region of the 20 SMA on the Daily Price Chart. Buying into any short term pull backs.
- Price Target 1: 12,942 – Price high of 2nd June 2022 and region of 50 SMA on the Daily Price Chart.
- Price Target 2: 13,569 – Region of the 100 SMA on the Daily Price Chart.
- Price Target 3: 14,000 – In extension, upper end of 2022 bearish trading channel.
- Stop Loss: < 12,345.
FTSE 100
The high-beta nature of the Nasdaq might offer greater gains if the market bounce continues; however, the FTSE looks a safer bet. The index can be expected to gain ground if the optimism surrounding stocks continues to build. It will also benefit from any further strength in the US dollar, which remains a market theme.
Multinational firms listed in London which make a large percentage of their profits from the non-UK business activity will see their earnings inflated by any weakness in sterling.
FTSE 100 Chart – 1 Day Candles – Year to date high
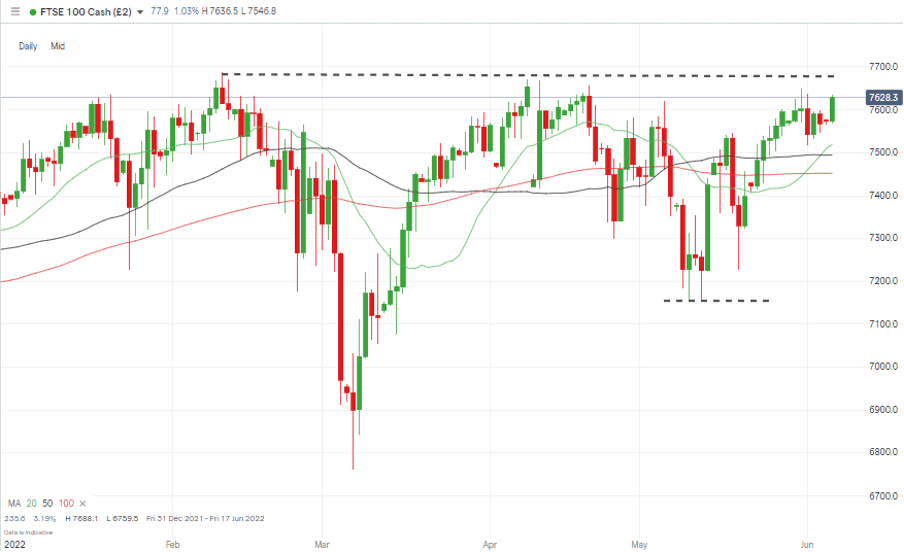
Source: IG
Long positions
- Entry Level 1: 7,519 – Region of the 20 SMA on the Daily Price Chart.
- Price Target 1: 7,688 – Price high of Friday 10th February 2022.
- Stop Loss: < 7,433 – Region of the 100 SMA on Daily Price Chart
Short positions
- Entry Level 1: 7,688 – Some profit-taking can be expected when price reaches the year to date high recorded in February.
- Price Target 1: 7,494 – Region of the 50 SMA on the Daily Price Chart
- Stop Loss: > 7,688 – Price high of Friday 10th February 2022. Year to date high.
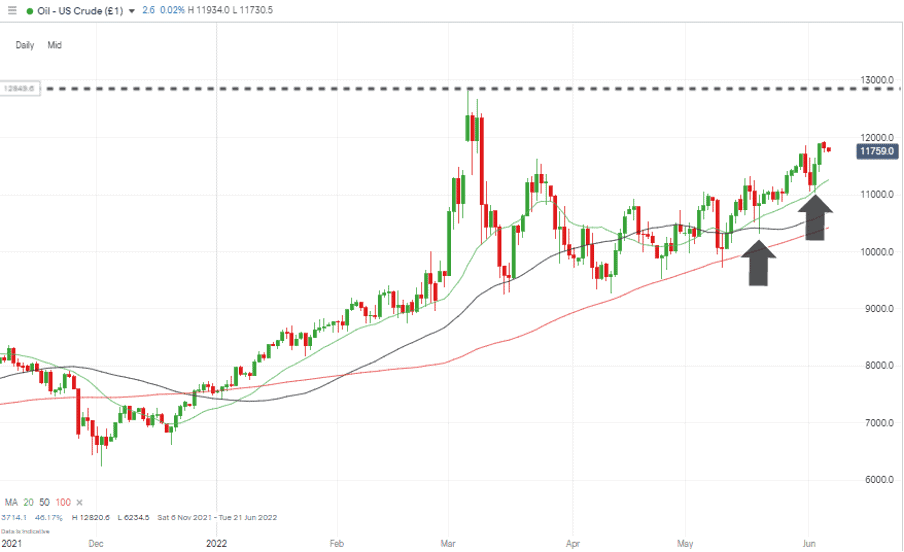
Oil
The OPEC+ meeting held last week did little to derail the continuing price surge of oil. The decision by the world’s biggest oil producers to stick with their agreed production levels will involve expanding production by 432,000 barrels per day in June.
The harmony among the OPEC+ group means technical indicators, specifically the 20 SMA on the Daily Price Chart, look set to be the metrics to watch. Price clipped the 20 SMA on 19th May and 2nd June and bounced on both occasions. That makes the $112.54 price level the one at which dip-buyers can take positions and join the upward momentum.
US Crude Oil – 1 Day Candles – Still following the 20 SMA
Source: IG
Long positions
- Entry Level 1: 112.54 – Region of the 20 SMA on the Daily Price Chart.
- Price Target 1: 128.20 – Price high of 6th March 2022.
- Stop Loss: < 104.20 – Region of the 100 SMA on the Daily Price Chart. Price has traded below the 100 SMA on only one occasion since 4th January 2022.
Short positions
- Entry Level 1: 112.54 – Region of the 20 SMA on the Daily Price Chart. A break of the 20 SMA would signal a period of price consolidation.
- Price Target 1: 106.92 – Region of the 50 SMA on the Daily Price Chart.
- Stop Losses: > 118.98 – Month to date price high recorded on 3rd June 2022.
Forex
GBPUSD
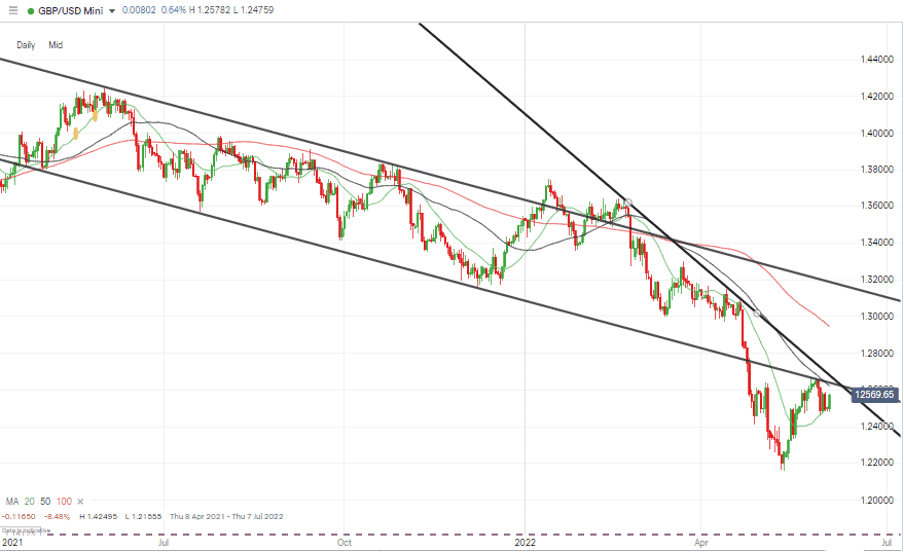
The +1% price fall in GBPUSD last week ended the relief rally that started on 16th May. The currency pair has lost momentum just as it reaches the support-turned-resistance trend line of May 2021. The 50 SMA offers an additional resistance point on the Daily Price Chart, which is currently in the region of 1.262.
The 20 SMA offers support on the Daily Price Chart, but a break of that level could point to the long-term downward price move resuming.
GBPUSD Chart – 1 Day Candles – Relief Rally
Source: IG
Short positions
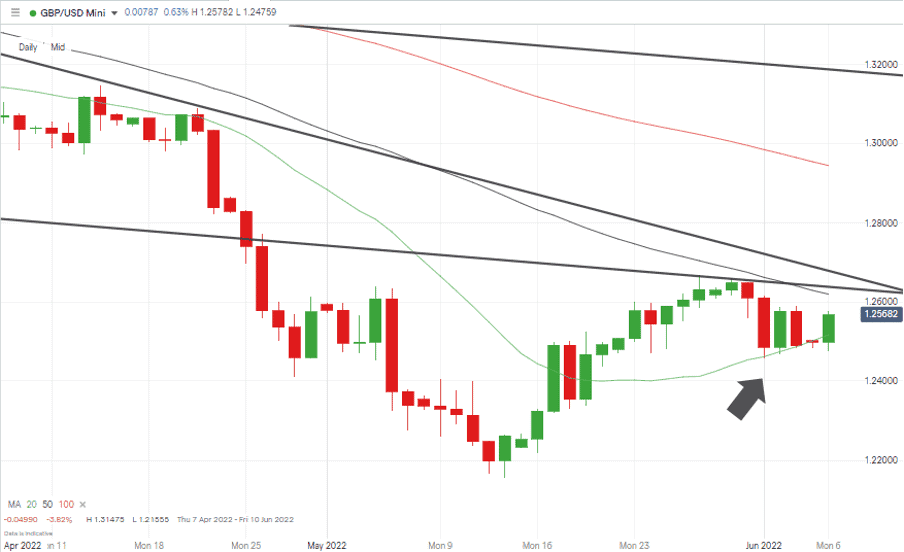
- Entry Level 1: 1.2517 – Region of the 20 SMA on the Daily Price Chart. Applying a breakout strategy looking for further downward price movement.
- Price Target 1: 1.2155 – Price low of 13th May 2022.
- Stop Losses: > 1.266 – Region of the 50 SMA on the Daily Price Chart and multi-month trendline resistance.
GBPUSD Chart – 1 Day Candles – 20 SMA & Trendline Resistance
Source: IG
Crypto – Bitcoin & Ethereum
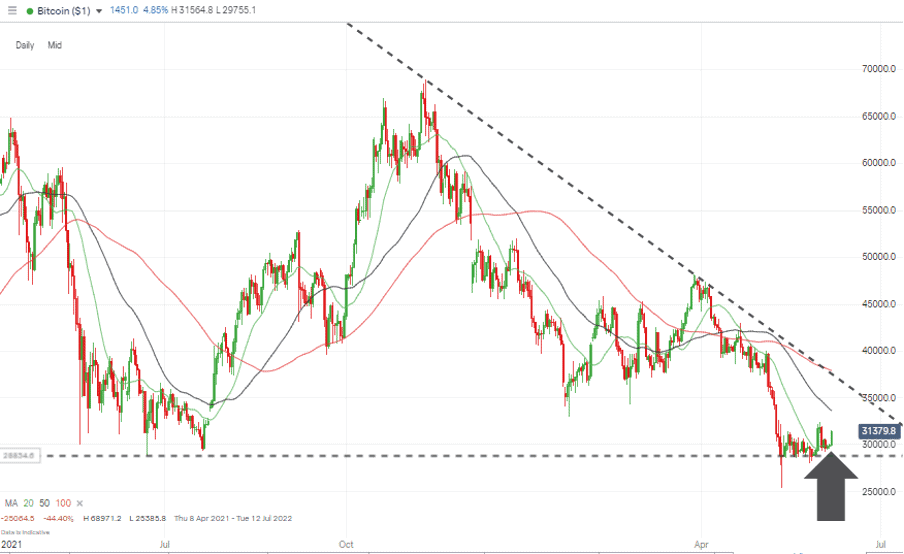
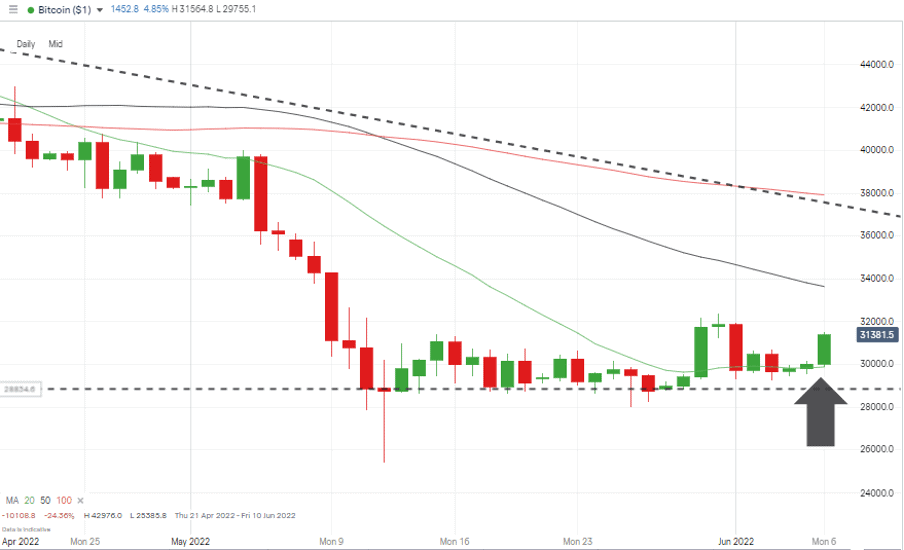
Bitcoin continues to outperform Ethereum. BTC coins gained 2.07% last week whilst ETH continued to lose ground and posted a 0.95% loss. The two coins also take a different approach to the key 20 SMA metric on their Daily Price Charts. BTC is largely trading above the SMA and is being supported by it, but ETH is trading below its own SMA and struggling to break through the resistance it offers.
Bitcoin Chart – 1 Day Candles
Source: IG
Bitcoin Long positions
- Entry Level 1: 29,875 – Region of 20 SMA on the Daily Price Chart.
- Price Target 1: 33,635 – Region of 50 SMA on Daily Price Chart
- Price Target 2: 38,800 – Region of the 100 SMA on the Daily Price Chart, resistance trendline dating from 24th January 2022, and $40k round number price bar.
- Stop Losses: < 25,385 – Below price low of Friday 13th May 2022.
Bitcoin Chart – 1 Day Candles – 20 SMA support
Source: IG
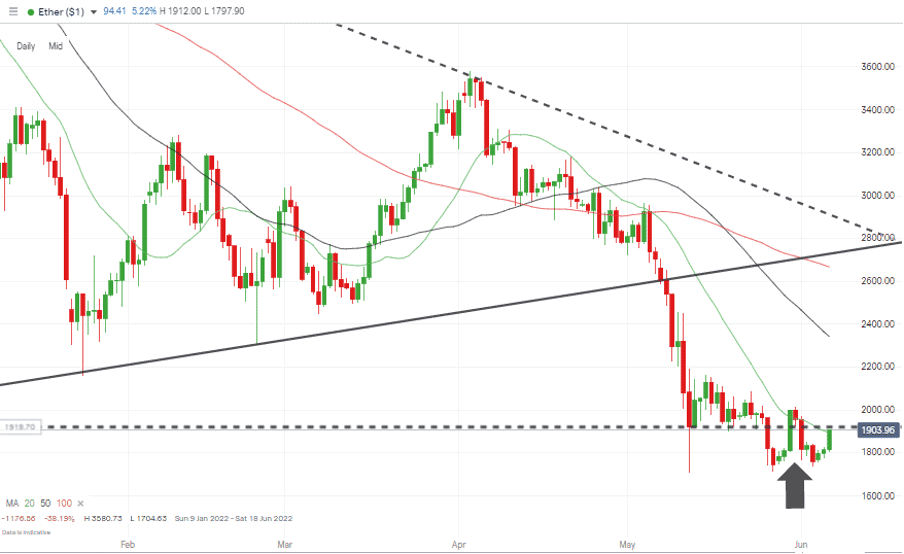
Despite trading below the key $2k price level, ETH continued to show signs of strength and was up 5.42% in intraday trading on 6th June. Many investors will be waiting for it to close above the 20 SMA on the Daily Price Chart before entering into long positions based on a breakout strategy.
Ethereum Chart – 1 Day Candles – Trading below key $2,000 price level and SMA resistance
Source: IG
Ethereum Long positions
- Entry Level 1: 2,000 – Psychologically important price level. A break above this price bar would signify that upward momentum is building.
- Price Target 1: 2,341 – Region of the 50 SMA on the Daily Price Chart
- Price Target 2: 2,666 – Region of the 100 SMA on the Daily Price Chart.
- Stop Losses: < 1,711 – Year-to-date low of 27th May 2022.
Risk Statement: Trading financial products carries a high risk to your capital, especially trading leveraged products such as CFDs. They may not be suitable for everyone. Please make sure that you fully understand the risks. You should consider whether you can afford to risk losing your money.

Forextraders' Broker of the Month
BlackBull Markets is a reliable and well-respected trading platform that provides its customers with high-quality access to a wide range of asset groups. The broker is headquartered in New Zealand which explains why it has flown under the radar for a few years but it is a great broker that is now building a global following. The BlackBull Markets site is intuitive and easy to use, making it an ideal choice for beginners.