
FOCUS ON: US Inflation Data Is A Potential Game-Changer
The inflation story dominating the market mood for the first half of the year could be about to take a new twist. Until now, countries worldwide have taken turns to announce double-digit price inflation sweeping through their economies. Trading the move has been based on monitoring the reaction of respective central bankers. Fresh data out of the US last week could change that.
Prices in major currency pairs whipsawed on Wednesday on the back of better-than-expected CPI inflation data out of the US. Core inflation, which excludes energy costs, was stable at 5.9% and lower than analyst forecasts of 6.1%. The headline CPI figure of 8.5% was also lower than the consensus forecast of 8.7%. It could be too early to draw any firm conclusions, but the fact that some are even asking if US inflation has peaked is a new development.
UK and eurozone reports do not show any signs of inflation easing off in the same way as in the US. That opens the door for a divergence between GBP, EUR, and USD and means that the UK and eurozone reports being released this week could create several trading opportunities.
Despite the Fed’s slow start in raising interest rates, its switch to a more aggressive approach appears to have doused at least some of the fire in the US economy. The UK CPI report due Wednesday 17th August could offer a view on how the slow and lightweight response by the Bank of England hasn’t had the same effect. If UK and eurozone central bankers realise their interest rate policy needs to be revamped, then the long-term bearish price patterns in GBPUSD and EURUSD could be about to turn.
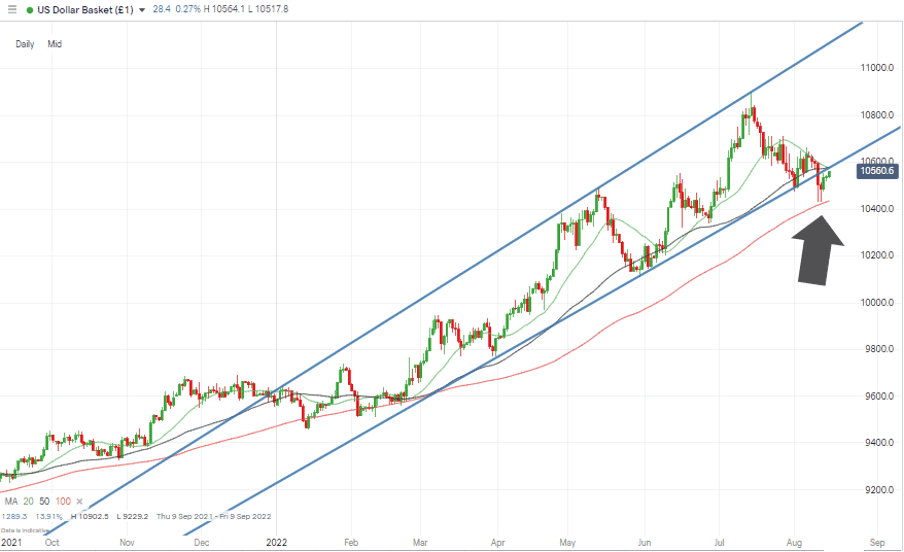
US Dollar Basket Chart – Daily Candles – Trendline Break & SMA Bounce
Source: IG
Last week’s Technical Analysis and Trading Ideas Report pointed to choppy trading conditions. Despite the US CPI report of Wednesday being a potential game-changer, immediate shifts in EURUSD and GBPUSD were followed by price retracements. Continued sideways trading can’t be ruled out thanks to the summer holiday mood spreading across trading floors and investors waiting to see if future reports confirm that US inflation has been tamed.
Instrument | Price | Hourly | Daily |
EUR/USD | 1.0239 | Strong Sell | Neutral |
GBP/USD | 1.2109 | Strong Sell | Strong Sell |
USD/JPY | 133.32 | Sell | Strong Sell |
S&P 500 | 4,267 | Strong Buy | Strong Buy |
NASDAQ 100 | 13,522 | Strong Buy | Strong Buy |
FTSE100 | 7,532 | Strong Buy | Strong Buy |
Gold | 1,791 | Strong Sell | Buy |
Crude Oil WTI | 90.57 | Strong Sell | Strong Sell |
Bitcoin | 24,225 | Strong Sell | Strong Buy |
Ethereum | 1,904 | Strong Sell | Strong Buy |
UTC: 08:22
Our trading signal analysis is based on a comprehensive summary of market data. We use a range of metrics with weighting given to simple and exponential moving averages and key technical indicators.
We created this Weekly Tips section to share possible trade entry and exit points based on our technical analysis. We also have other methods to validate our trades which we can’t publicly share that help to increase their success. All our trades include entry and at least one target price. Stop losses are applied at the reader’s discretion. Our strategies typically trade with a wide stop loss, and risk is further mitigated by trading in small sizes.
Forex
GBPUSD
A busy week regarding data releases could provide various trading opportunities in GBPUSD. Unemployment numbers are due on Tuesday, 16th, and the all-important Consumer Price Index (CPI) data will be released on Wednesday, 17th August.
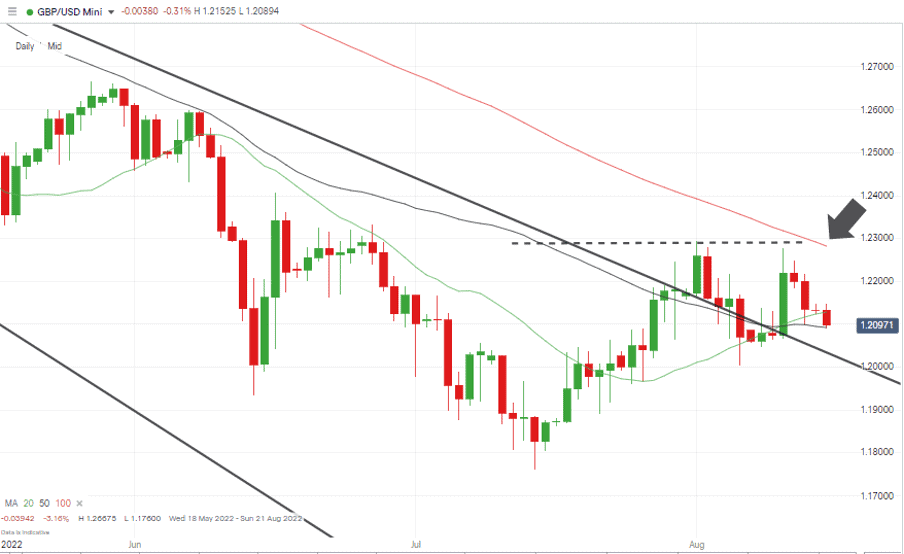
GBPUSD Chart – Daily Candles – No New Swing-High
Source: IG
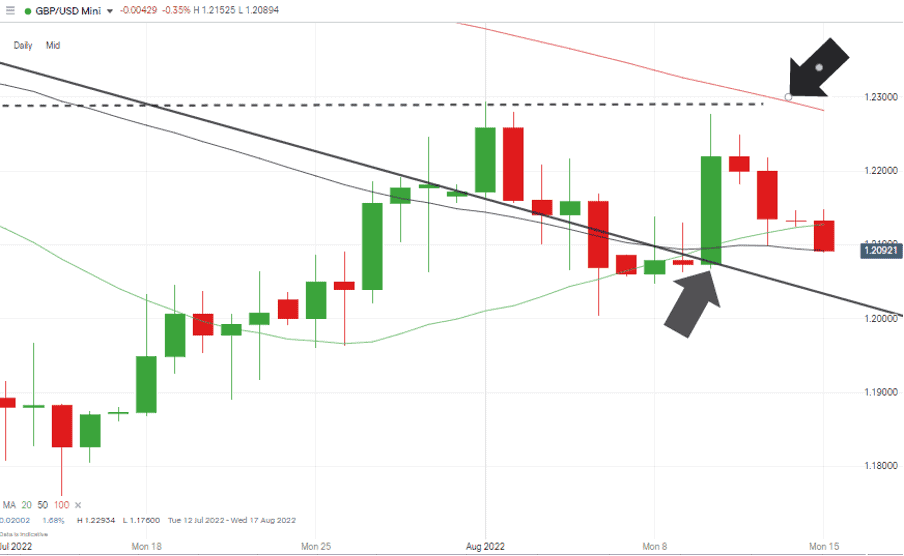
The bounce off the trendline on Wednesday would have allowed traders using the Technical Analysis and Trading Ideas Report to enter into trades at 1.20768. Despite the subsequent pull-back, those trades would still be in profit and a way of catching any further movement to the upside if the economic reports on Tuesday and Wednesday point to the UK economy overheating.
GBPUSD Chart – Daily Candles – Bounce on US CPI News
Source: IG
Banking some profits on long positions might not be a bad idea. Significant resistance sits in the region between 1.22818 and 1.22934. These levels are the 100 SMA on the Daily Price Chart and the month-to-date high of 1st August.
Short positions
- Entry Level 1: 1.22818 – Region of 100 SMA on the Daily Price Chart.
- Entry Level 2: 1.22934 – Month to date high of 1st August.
- Price Target 1: 1.20917 – Region of 50 SMA on the Daily Price Chart.
- Price Target 2: 1.17600 – year-to-date price low of 14th July 2022.
- Stop Loss: > 1.23 – Psychologically significant round number and above the 100 SMA on the Daily Price Chart.
Long positions
- Entry Level 1: 1.20326 – Buying into any short-term price weakness and using the trendline as a guide. Nothing is guaranteed in the markets, but this strategy worked effectively last week.
- Price Target 1: 1.22818 – Region of the 100 SMA on the Daily Price Chart
- Price Target 2: 1.22934 – Month to date price high printed on Monday 1st August. Last week’s three-day rally took price close to this level, but it fell away just before reaching it.
- Stop Loss: < 1.2000 – Psychologically important price level.
EURUSD
The eurozone is due for a relatively quiet week in terms of news announcements. German ZEW economic sentiment is reported on Tuesday 16th, Q2 GDP data is scheduled to be released on Wednesday 17th, and German Producer Price Index numbers are out on Friday 19th August.
It’s by no means the busiest week, but there could still be opportunities to trade signs that the US and eurozone inflation levels and interest rate policies are about to diverge.
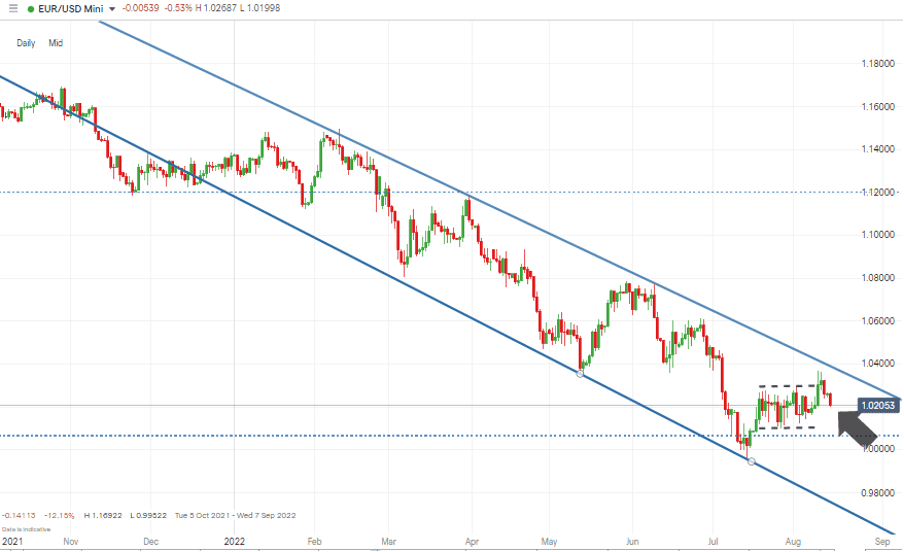
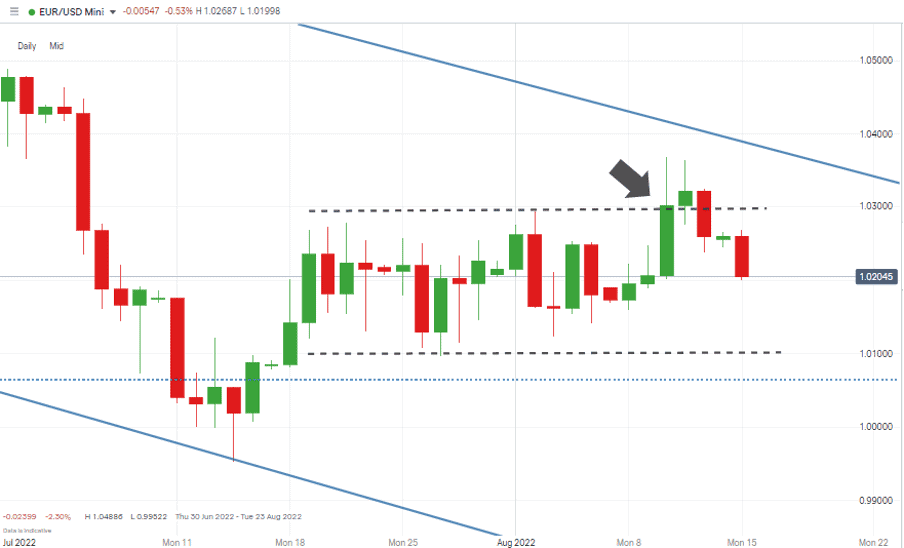
EURUSD Chart – Daily Candles – Long-term Downtrend
Source: IG
Last week’s breakout of the sideways trading channel only lasted two days, and unless the Ukraine-Russia situation flares up again, range-based strategies could be the best option. Any upward movement in EURUSD would face stiff resistance in the region of 1.03.
EURUSD Chart – Daily Candles – Failed Breakout
Source: IG
Short positions
- Entry Level 1: 1.0294 – Price high of 2nd August 2022, which marks the top of the sideways trading range, also close to the psychologically important 1.03 price level.
- Price Target 1: 1.0009 – Price low of 27th July 2022, which marks the bottom end of the sideways trading channel.
- Price Target 2: 0.99522 – Year to date price low recorded on 14th July 2022 and region of potential triple-bottom on the Monthly Price Chart.
- Stop Loss: > 1.03687 – Intraday price high of Wednesday 10th August.
Long positions
- Entry Level 1: 1.0009 – Buying into any weakness that takes price to the lower region of the sideways channel. Price low of 27th July 2022.
- Price Target 1: 1.0300 – Upper end of sideways channel.
- Stop Loss: < 1.0000 – Psychologically important price level.
As with last week’s report, both short and long positions following a range-trading approach could use the 20 SMA on the Daily Price Chart as a place to crystalise some gains. That metric still sits in the middle of the channel in the region of 1.021.
Indices
NASDAQ 100
Major stock indices continue to rally on the back of weaker-than-expected US inflation data. Tech and growth stocks are leading the charge, with the Nasdaq 100 posting another weekly gain of more than 2%. Earnings season is still in progress, with attention turning to reports due to be released by big retailers.
NASDAQ 100 Chart – Daily Candles – Trendline Break
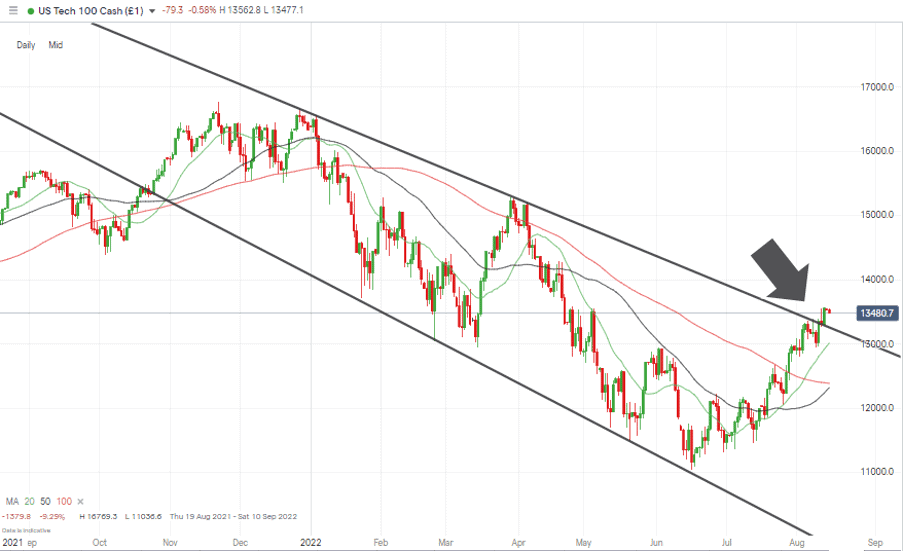
Source: IG
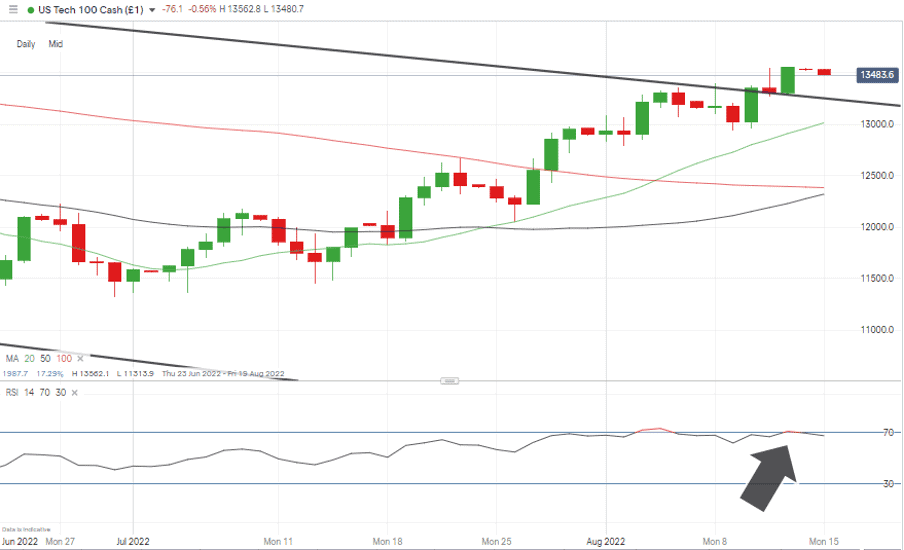
Those earnings reports will offer a different view on the health of the US consumer, and any ‘misses’ could result in a short-term sell-off. The RSI on the Daily Price Chart reached 70 on Friday 12th August, suggesting that the market could currently be overbought on that timeframe.
NASDAQ 100 Chart – Daily Candles – RSI > 70
Source: IG
Long positions
- Entry Level 1: 13,264 – The path of least resistance continues to appear to be upward but chasing the move is risky with the RSI above 70. Buying into any short-term profit taking would appear to be the best approach. A return to ‘kiss’ the trendline in the region of 13,264 would offer a buying opportunity at a price level which previously acted as resistance but now offers support.
- Price Target 1: 14,000 – Round number resistance and just below the 20 SMA on the Monthly Price Chart (14,115).
- Stop Loss: < 13,016 – Region of the 20 SMA on the Daily Price Chart and just above the ‘round number’ support of the 13,000-price level.
Crypto – Bitcoin & Ethereum
Ethereum’s outperformance continued with ETH up more than 10% last week whilst BTC increased in value by 2.94%. The tech upgrades of the Ethereum blockchain appear to be finally coming good, opening up the platform to a wider audience.
The path of least resistance for ETH continues to appear upward, but the bounce back off the $2,000 level does open the door to some short-term price consolidation.
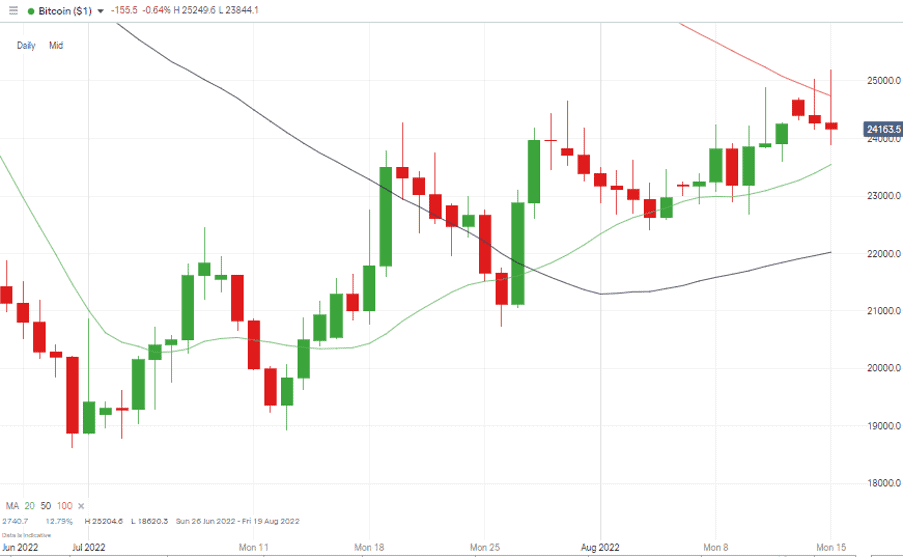
Bitcoin Price Chart – Daily Candles – SMA Resistance
Source: IG
Bitcoin Long positions
- Entry Level 1: 23,547 – Region of 20 SMA on Daily Price Chart.
- Price Target 1: 24,735 – Region of 100 SMA on Daily Price Chart.
- Price Target 2: 28,286 – Region of 20 SMA on Weekly Price Chart.
- Stop Losses: < 19,263 – Region of the 76.4% Fibonacci retracement which dates back to March 2020.
Ethereum
Ethereum Chart – Daily Candles – Above SMAs & 2k Resistance
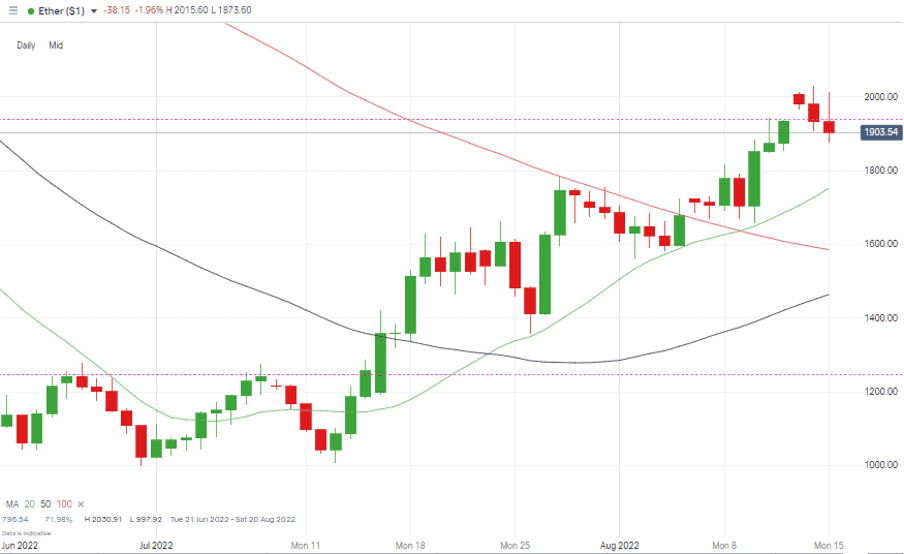
Source: IG
Ethereum Long positions
- Entry Level 1: 1,752 – Some patience will be needed to buy into weakness in the region of the 20 SMA on the Daily Price Chart.
- Price Target 1: 1,938 – Fibonacci Retracement resistance level and close to psychologically important 2,000 price level, which was clipped last week but acted as resistance.
- Stop Losses: < 1,585 – Region of 100 SMA on Daily Price Chart
Risk Statement: Trading financial products carry a high risk to your capital, especially trading leverage products such as CFDs. They may not be suitable for everyone. Please make sure that you fully understand the risks. You should consider whether you can afford to risk losing your money.

Forextraders' Broker of the Month
BlackBull Markets is a reliable and well-respected trading platform that provides its customers with high-quality access to a wide range of asset groups. The broker is headquartered in New Zealand which explains why it has flown under the radar for a few years but it is a great broker that is now building a global following. The BlackBull Markets site is intuitive and easy to use, making it an ideal choice for beginners.