Trading involves numbers. We need to make a lot of calculations to analyze the price action and gain an understanding of market movements. While economic events usually follow a discernible pattern of cause and effect that may be evident even without the use of technical methods, it is difficult to evaluate the random movements of the price without the tools supplied technical methods.
As it is difficult to define entry/exit points without the use of numbers, numerical tools have been very popular among traders of all backgrounds since the early days of the development of technical analysis. Over the years, the desire to condense and solidify technical strategies into clearly delineated schemes on which trading choices can be based has resulted in a better understanding of what constitutes a successful technical strategy or not. But while what is expected is nowadays clearer, the nature of trading as an activity where risks are ubiquitous makes testing the success of a trading strategy a complicated and difficult task. In this article, we’ll attempt to discuss some of the basic principles on the successful testing and evaluation of a trading strategy. Instead of discussing the various tools used by traders, we will seek to assess the validity of the basic approach to the testing of technical methods.
Constructing a technical strategy
But first of all, what is a technical strategy? A technical strategy is a combination of various indicators and tools which aims to smooth out the gyrations in prices in order to generate actionable signals for traders. At its basic level, traders are using strategies every day as they analyze the markets and enter buy and sell orders in accordance with their analyses. By combining a price indicator such as a line chart or bar chart, with an oscillator or a moving average, we already have a very simple scheme which will allow the determination of entry/exit points for our trades. As traders become more proficient in technical analysis, the tendency is towards the creation of more complicated schemes which combine a large number of indicators to generate signals.
It is not very difficult to construct a technical strategy. The diverse choice of indicators available to traders ensures that those who seek to combine them for deriving sharper, more precise signals will not need to seek far and wide in achieving that goal. To illustrate this clearly, let’s take a look at the following two scenarios where we have developed two arbitrary methods with which we want to trade the markets.
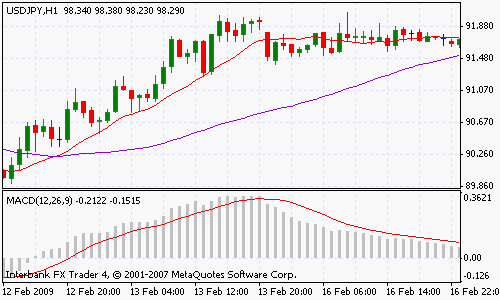
The above method involves the use of two moving averages, a 13-period simple moving average (SMA), and a 50-period SMA to generate signals from crossovers, while using the MACD to filter out extreme values where sharp reversals could blur the risk/reward scenario for trading. Indeed, in this randomly selected example, we notice that our scheme is performing well. The entry signal generated by the 13/50 crossover on 12th February signaled an incipient hourly trend which kept going on by remaining above the 13-hour SMA, until it ran out of energy, coinciding with the extreme value registered on the MACD oscillator. It is clear that our simple method is generating promising results on this first example.
Now let’s examine another method.
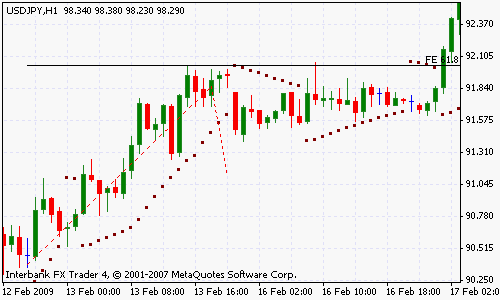
In this example on the same price chart, where we have used the parabolic SAR in combination with a long term resistance line and fibonacci extension levels we observe that the breakout was in line with the signals generated by our simple strategy. As soon as the price moved above the parabolic SAR on 16th February night, the breakout took the price above the 61.8 Fibonacci extension level, and the trend then continued moving upwards until reaching another higher resistance level.
Both of these cases show that these simple combination of basic tools can be successful in creating a profitable trading strategy. But naturally, we want to use only one of the two, because applying two strategies to the same chart will often result in confusing outcomes without generating much clarity on the risk ratio. This is where the evaluation of a technical strategy acquires its critical nature. By testing various strategies before applying them, we hope to find the better ones instead of discovering them in consequence of a string of losing trades.
Why backtesting may not be useful
Backtesting of technical methods in light of past prices is the most popular testing strategy among technical traders. That price patterns repeat themselves is a basic principle of technical analysis. By interpreting this principle to imply that the past performance of a trading strategy can guarantee or at least validate its returns in future markets, backtesting aims to weed out the less profitable tools and filter the most promising ones to be used in trading.
But while it is popular, forex backtesting is made a questionable tool by the chaotic, and constantly changing nature of the markets. Not only does the quote change, but even the rules that define the quote also change, ensuring that a method valid today may not be very useful after the passage of a short while. When we are backtesting a strategy, all that we are testing is its effectiveness in conditions that may never be repeated again. Of course, triangles, pennants, breakouts occur all the time, but the precise configuration of each of these patterns is different enough to invalidate the application of past trading choices at each and every single case.
Backtesting also ignores the fact that market fluctuations are random. While trends are much more predictable, short term fluctuations, the brief spikes and collapses that are a part of them are random, which means that it is impossible to predict where they will occur on the basis of past information. The relationship between past and present fluctuations is as strong as that between a coin toss today and one tomorrow: there’s no relationship, in other words.
Evaluating a technical strategy
In spite of the disadvantages mentioned above, various reasons ensure that backtesting will remain popular among traders. First, the only concrete data on the basis of which evaluations can be made is supplied by historical prices. In the absence of such historic data, traders will feel like they are fumbling in the dark while trying to determine the value of a trading method. In addition, backtesting is easy to perform. On a reasonably powerful machine it takes a relatively short time to test the success of a technical method using the tools supplied by the popular charting packages. And for salespeople, the certificate of approval provided by good backtesting results is too precious to ignore. Finally, the results of backtesting are easy to explain and understand. The data speaks for itself, and while the technical strategy may be opaque on how it works, the unmistakable presence of positive returns over the timeframe of testing convinces many to disregard any doubts or misgivings about its efficiency.
So if we decide to take backtesting into consideration while evaluating trading methods, we should at least make sure that we don’t limit ourselves to a mere statement of the profit/loss ratio, or the maximum drawdown generated on the basis of historic data. There is no justification that the reliability of a strategy in light of backtesting will translate to reliability in the future. Consequently, successful study of a strategy must involve the non-technical aspects of trading in its calculations. While a system may signal that a trade must be initiated, there’s no guarantee that the trader will act on the signal, due to myriad reasons. Even if the trading method is fully automated, there’s nothing to prevent the trader from tampering with the parameters to change the way in which it works in order to eliminate a perceived risk, to reach at greater profits, or just for emotional reasons. Thus, actual testing must involve a lot more than a mechanically generated string of numbers which have no significance at all in terms of profits or losses.
Statistical analysis, and some numerical tools, such as the z-score, may be beneficial for understanding the behavior of a strategy. While they cannot tell us how profitable the combination will be in the future, we can at least gain an understanding of the profit/loss patterns generated by it, which can in turn help us incorporate them into our trading strategy.
How to use a technical strategy
This text is mostly concerned with evaluation of technical strategies, but we will add a few ideas on their use in order to illustrate our purpose better. As we just mentioned, the best way of testing a strategy is using it in low leverage, low risk situations where losses should be affordable and tolerable. To perform this kind of testing, it is clear that we must have a clear trading plan which will also be our testing ground, so to speak.
If, after a period of backtesting we acquire some confidence that a strategy is generating good returns, the next stage is incorporating it into our overall trading plan in light of the risk tolerance of our portfolio, and the sensitivity of our character to market extremes and volatility. Thereafter the best course will be to increase leverage, and double our deposit everytime we are able to triple the size of our account by successful and profitable trades. This may sound like a lot, but if a technical method is successful, and if the returns are consistent, it shouldn’t be that hard to double or even triple an account in the time frame of one or two years. What is more, we are not limited to testing a single strategy in this way. It is possible to run multiple tests of maybe ten or more technical strategies in different accounts using sums as small as $10, in order to gauge their success.
By this kind of testing, not only will we gain actual experience and understanding of the markets, but our tools will be tested in a real market environment where the risks and the rewards are meaningful and credible. We will be trading and testing at the same time, with minimal risk and maximal returns in terms of the long term profitability of our account.
Conclusion
The belief that backtesting can help identify strategies with potential is common, but it is unsubstantiated by evidence or experience. The best way of testing a strategy is by testing its actual performance, which means that we should evaluate the actual gains and losses registered by using it, instead of hypothetical successes and failures in past situations. As long as the sums that are used for this purpose are small and leverage is sensible, the losses that may result are affordable, and even advisable as part of the learning process: a trader must surely learn how to lose, if he plans to have any chance of making profits.
In sum, the best and most reliable testing can be performed in actual market conditions, by real traders with real money, where the rewards and returns lead the losses and profits in the account. In addition, no amount of testing will prove that a technical combination will perform well in all similar market configurations. It is an important property of the market action that similar precedents lead to differing results, and unless we keep this in mind, the benefits of testing will be negated by the illusions generated by it.
All articles about automated forex trading
Next >> Primary Considerations when back testing a trading system >>
Previous << Benefits of mechanical trading systems <<

Forextraders' Broker of the Month
BlackBull Markets is a reliable and well-respected trading platform that provides its customers with high-quality access to a wide range of asset groups. The broker is headquartered in New Zealand which explains why it has flown under the radar for a few years but it is a great broker that is now building a global following. The BlackBull Markets site is intuitive and easy to use, making it an ideal choice for beginners.