
The wedge pattern is a common formation followed by technical analysts to forecast price reversals, often with a high percentage of accuracy. They are identified on a price chart by drawing two converging trendlines that resemble a wedge, which can either signal a bullish or bearish price reversal.
In this article, we will explore both the ascending wedge and descending wedge price patterns, their main characteristics, and how to trade them.
The Ascending Wedge pattern
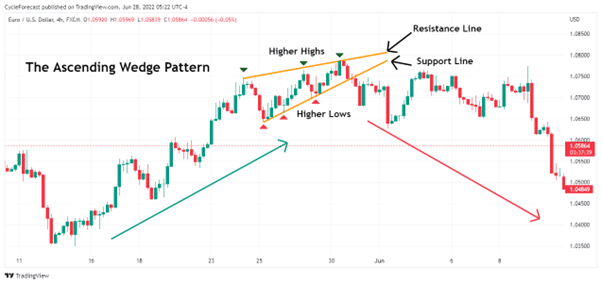
Image for illustration purposes only
The ascending wedge, also known as a rising wedge, can be seen as a bearish reversal pattern that can either form after a market has been trending higher over time or during a corrective phase in a downtrend.
The chart example above shows two converging trendlines (orange lines) that were drawn above and below the price structure of a market during the final phases of an uptrend, revealing what an ascending wedge pattern looks like.
To draw the upper resistance and lower support lines, technical analysts will connect the higher highs and higher lows with trendlines to see whether price is contracting within a narrowing range as price moves higher.
The narrowing range toward the end of this bull run signalled that the upward momentum was decreasing and that a strong reversal might occur at any moment.
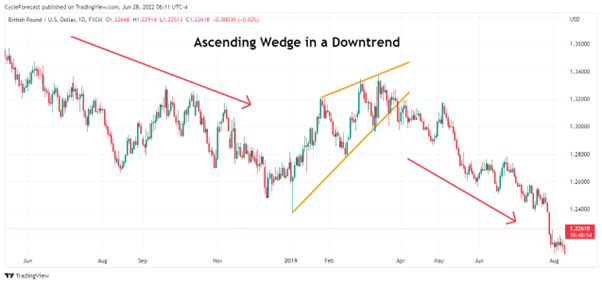
Image for illustration purposes only
The next chart example shows an ascending wedge pattern that formed during a downtrend. Here also, the trendlines started to converge as price moved higher within a narrowing range towards the end of the pattern.
Both of the above ascending wedge pattern examples formed prior to strong bearish reversals, which is why traders will seek to make a profit on the assumption that prices will fall when this pattern ends.
The Descending Wedge pattern
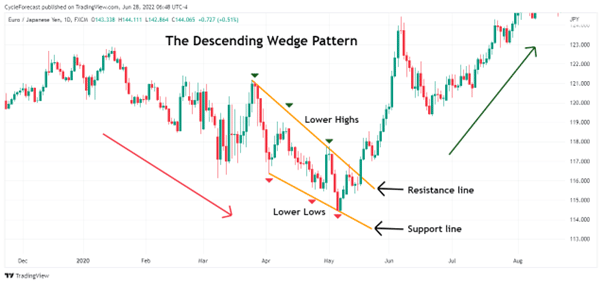
Image for illustration purposes only
The descending wedge pattern, also known as a falling wedge, typically appears at the end of a bearish market before a strong bullish breakout occurs. Both the upper resistance and lower support lines also converge as price moves lower in a narrowing range. With descending wedges, the upper and lower trendlines are drawn by connecting the lower highs and lower lows to form the familiar wedge shape.
Next, we will look at how traders use these popular wedge patterns to enter trades, place their stop losses, and set their targets.
Related Articles
How to Trade the Ascending Wedge Pattern
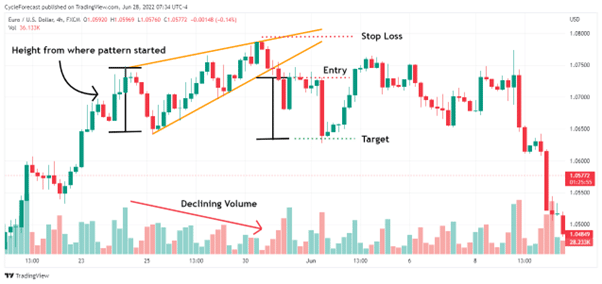
Image for illustration purposes only
As the ascending wedge pattern forecasts a potential bearish reversal, traders will first wait for price to break below the lower trendline support to signal that the pattern has ended before they plan their entries.
Another important characteristic of a wedge pattern (other than the converging trendlines) is that volume (or momentum) tends to decline towards the final stages of this formation. It is often a good idea to use another form of technical analysis to confirm that you are dealing with a high probability pattern setup.
Note how volume significantly declined after the beginning phases of the wedge pattern. This is a common occurrence during an ascending wedge formation and confirms that the buyers of a market are getting less interested in opening long positions, or that they are starting to take profits.
Later on, we will look at another indicator that can be used to identify a decrease in momentum.
When it comes to finding an entry level to short the market, traders can choose between an aggressive and a conservative entry method.
Aggressive entries can be taken as soon as price breaks the lower support line for the first time, with a stop loss positioned above the swing high from where the pattern ended. A target level can be calculated by measuring the height at the start of the wedge pattern (black lines) and projecting it lower (by the same distance) from the entry level.
Conservative entries can be taken after price breaks below the lower support line, but traders following this method will also wait for a retest of the lower support line before they enter (as in the example below).
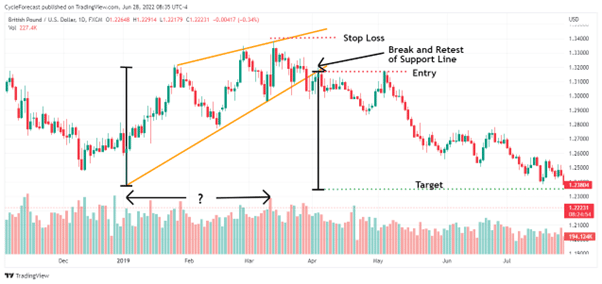
Image for illustration purposes only
The second chart example shows the conservative entry method, whereby traders will wait for a break of the lower support line and a retest of the same line before they enter short positions.
Both the stop loss and target levels were calculated using the same instruction as before. The conservative entry method, however, might not always happen, especially when the resulting breakout moves too fast with an increase in momentum.
Note that there was no clear decline in volume in this example, unlike the previous chart image. Although a decline in volume is a typical characteristic of these patterns, it is also important to note that not all patterns will always behave in the same way – which is why it would make sense to be flexible and use another popular indicator to achieve the same goal.
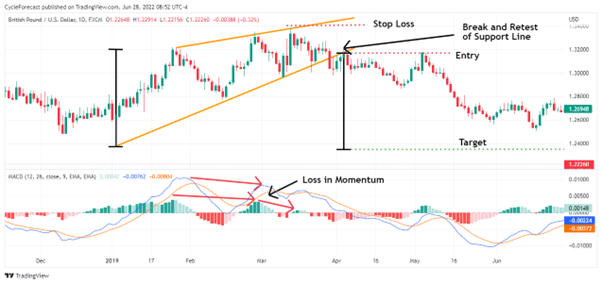
Image for illustration purposes only
The moving average convergence divergence indicator (MACD) is a great tool to spot declining momentum in a market. Whenever a market continues to make higher highs (or lower lows) during a trending phase but the momentum at which price is moving starts to decline, this is referred to as momentum divergence.
Momentum divergence, just like declining volume, tends to occur prior to reversals and can be seen on the chart above. Both the MACD-Histogram (green and red bars) and the MACD line (blue line) started moving lower as price continued making higher highs.
Using the MACD indicator to spot momentum divergence is another way to help you make better trading decisions when following the wedge pattern.
Wedge Pattern Trading Examples
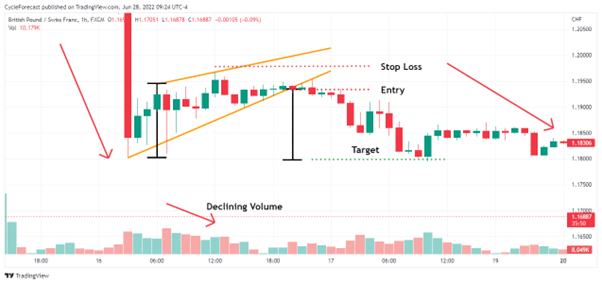
Image for illustration purposes only
Wedge patterns show up on all timeframes, as was the case with this market that formed an ascending wedge pattern on the one-hour timeframe during a downtrend.
Even volume started to steadily decline before the pattern ended, and once price broke below the lower support line, the previous downtrend resumed.
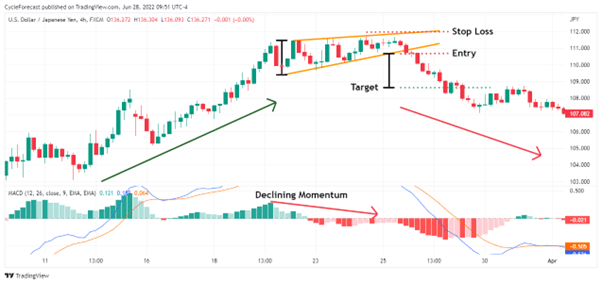
Image for illustration purposes only
Our final trade example shows an ascending wedge pattern that appeared on a four-hour timeframe, right at the end of a bullish trend. This is another great example of how momentum declined on the MACD indicator during the wedge formation before price broke the support line and a strong reversal followed.
Conclusion
The wedge pattern is one of the easiest trading patterns to identify on a chart because of the clear wedge-like shape that forms. Knowing the two types of wedge patterns, when they tend to appear, and the likely direction that price will break out when a reversal occurs gives any trader a real trading edge.
In this article, we also looked at two indicators that can greatly assist a trader to spot high probability trading opportunities, and you might decide to use either one of them, or maybe both in combination.
Another advantage that this particular pattern has over other patterns is that your stop loss placement will often be very close to your entry level, thereby maximising your returns when price reaches your target.
Understanding chart patterns is an important part of technical analysis and many trading strategies include them. Hopefully, this article helped to shed some light on the popular wedge pattern and provided you with the knowledge necessary to trade it.
Don’t Trade Before you see this!
We consulted our team of experts and put together 10 tips to help improve your trading.
These tips could help make you a better trader – and we’re giving them away for free!

Forextraders' Broker of the Month
BlackBull Markets is a reliable and well-respected trading platform that provides its customers with high-quality access to a wide range of asset groups. The broker is headquartered in New Zealand which explains why it has flown under the radar for a few years but it is a great broker that is now building a global following. The BlackBull Markets site is intuitive and easy to use, making it an ideal choice for beginners.