
As forex traders soon realize, their foremost tool for tilting market odds in their favor is the use of Technical Analysis or TA for short. Within that toolbox, technical indicators, which come in a wide variety of shapes and sizes, are the key to a winning forex trading strategy. The “Larry Williams %R” is just one of many momentum type indicators that have proven their worth over time.
Despite what market theorists and academicians might profess, markets do gyrate in waves, and, in so doing, prices do tend to overshoot targets and overextend trends, a process that can be detected and measured. The types of TA indicators used for this purpose are commonly referred to as oscillators. The Larry Williams %R joins a class of better-known tools, such as the Relative Strength Index (RSI) and Stochastics, both fast and slow.
Analysts designed oscillators to signal when market prices were either in an overbought or oversold condition. Each of these tools may have small differences in its formula and how it provides its respective signals, but the objective is to gauge the health of the trend in question. The benefits occur at the extremes of the indicator’s measurement scale. Typically, a slower line will cross a faster one, an indication of a potential shift in market direction.
Larry Williams developed his namesake R% early in his career. It is a percentage-type oscillator, which is often said to resemble the Stochastic indicator. The specific formula for the “%R” factor is applied over a “look-back period”, typically 14 days. While the premise is straight forward, the calculations could prove to be very tedious for a beginning trader, but thankfully, the modern trading platforms of today do the computations instantaneously in the background for you. Here is the detail for the Larry Williams R indicator:
Williams %R = ((Highest High – Close)/(Highest High – Lowest Low)) X 100
Where:
- Highest High = Highest price in the look-back period
- Close = Most recent closing price
- Lowest Low = Lowest price in the look-back period
The first value occurs after 14 days, and the calculations repeat going forward using new reference points. The key reference levels for trading applicability, as with many other oscillators, occur when the value line crosses either the “20%” or “80%” thresholds. The Larry Williams %R only has a single signal line, as with the RSI. Stochastic indicators have two signal lines to provide another level of confirmation after the thresholds are breached.
As with any other TA indicator, the Larry Williams R is not meant to be perfect. It may behave differently during opposing timeframes or whether the market is ranging or trending. False signals are a possibility, since previous pricing behavior is never a guarantee of what direction a market might take in the future. The “%R”, however, can give you an edge, which, when consistently applied, can lead to winning trades over time. Practice time is advised in order to become familiar with the idiosyncrasies of this well respected momentum indicator.
Background to the larry williams %R indicator
Larry Williams has become one of the most famous and successful traders in the fields of futures, commodities, and foreign exchange. He was born in 1942 in Montana in the United States. After graduating from college in journalism, he began trading currencies in 1965 and soon became a respected commentator whose views on the markets were seen as innovative. He is best known for his R% indicator, but he also developed the Ultimate Oscillator, COT indices, and other measures for market sentiment and cycle forecasts.
He rose to fame, however, by winning the World Cup Championship of Futures Trading in 1987. Over one twelve-month period, he was able to transform his beginning investment of $10,000 into an incredible amount of $1.1 million. News soon spread of his groundbreaking approach to trading. He then used his journalism training to write and publish a book that encapsulated his entire trading experience over the year. He went on to publish another ten books and numerous videos on related financial topics.
Unfortunately, stories like these have attracted hordes of neophyte traders, intent on getting rich quickly. The market’s hot flame often punishes those beginners, who do not have the training and preparatory work necessary to ensure success. Yes, one can build an effective trading strategy using the principles incorporated in the Larry Williams R% indicator, but success is not a given.
As with every other indicator, the R% does have its limitations. A healthy practice regimen will reveal a host of valuable insights that this indicator can provide, but the R% at best can only highlight potential winning opportunities. Markets are fickle. Directions can change quickly. A veteran trader knows when to adapt, to switch gears, and seek out a new favorable trade setup.
Related Articles
Examples of larry williams %R Indicator
The best path for understanding the many uses of the Williams R% indicator is to review a chart:
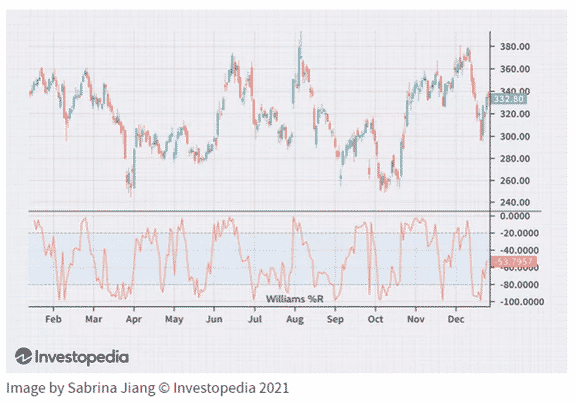
The above chart, courtesy of Investopedia, depicts the value tracking for the R% factor for a very volatile asset over the course of a year. If you were familiar with other similar oscillators, then you would first notice that the scale on the right side of the chart is reversed. A negative sign has been inserted for clarification, but values between “-80” and “-100” denote an oversold condition. The opposite is true for values between “-20” and “0.00”, i.e., overbought territory.
The Williams R% indicator is also described as a bound oscillator, since traders tend to focus on the extreme boundaries at each end of the value scale. There are also valuable insights at the 50% midpoint, as well. A quick summary follows:
- Oversold/Overbought Conditions: When prices enter one of these zones, it could indicate that a reversal is imminent. The timing of the actual reversal is open for debate, since the indicator cannot predict that exact point with any certainty. In other words, a bearish or bullish trend may extend for a period of time before prices exit the extreme boundary regions. Even when the prices exit a boundary region, the signal, may be a false positive. Observe the October/November activity. Prices rose sharply, only to fall abruptly. The R% exited overbought territory, but quickly returned.
- Mid-Point Considerations: The “-50%” value can provide an additional insight as to the force behind the reversal at hand. Look once again to late November on the chart. After the previous “head fake”, prices fell from overbought sharply, passing the mid-point line in the process. The reversal was a 15% price change in a matter of days, also entering the oversold region just as quickly, only to exit and pass the “-50%” mark once again.
- Momentum Failure: The financial security in this chart has demonstrated very strong price movement trends, but when does the R% give you an indication of weakness in a market move? Observe the March decline in prices. Prices dipped at the beginning of the month and appeared to be headed for the “-20” region. The R% value had crossed the “-50%” valuation, but it soon halted, a sign of weakness and a definite signal that price momentum had lost strength
How does a trader become acquainted with the above nuances of the Williams R% indicator? There is no shortcut for experience, which must be achieved through hours of practice on a free demo trading system. Build your trading strategy around these concepts. Get comfortable with the R% signals and fine-tune your strategy as you become more acquainted.
Be Wary – All Indicators Have Limitations
Veteran traders have learned the hard way and have scars to prove it – Never try to guess the exact timing of reversals in the market. The R% indicator is helpful in suggesting when a reversal might be imminent, but it is prudent to use another technique to confirm that a change in direction has taken a stable turn. Waiting for the “-50%” crossover is one technique. Doubling up with another oscillator like the RSI for trending markets and Stochastics for ranging markets can be another method. Volumes, chart patterns, candlesticks, and Fibonacci levels are helpful, too.
Concluding Remarks
Larry Williams is a prominent member of the Forex Trading Hall of Fame and rightly so. His indicators and books have stood the test of time. Videos of his various theories proliferate the Internet, and in case you were curious if his talents are transferable, he trained his daughter in his craft and she also won the World Cup Championship of Futures Trading in 1997 ten years after he did. He is now 80 years of age and is a major contributor to several global charitable efforts.
The Larry Williams R% indicator is his most famous contribution to the world of forex trading. It, too, has stood the test of time and can form the basis of an effective and sound trading strategy. As with all indicators, however, the R% is by no means perfect. It can give false signals, too, but it can pinpoint potential trading opportunities for you, which could prove favorable. Practice before using is the best advice. Get familiar with how it operates in up and down markets, as well as in trending and ranging markets. Your practice regimen will always bear fruit down the road.
Continue Learning
- Forex Glossary
- What is Devaluation?
- What is Implied Volatility?
- What is a Trailing Stop Loss?
- What is a Flag and Pennant?

Forextraders' Broker of the Month
BlackBull Markets is a reliable and well-respected trading platform that provides its customers with high-quality access to a wide range of asset groups. The broker is headquartered in New Zealand which explains why it has flown under the radar for a few years but it is a great broker that is now building a global following. The BlackBull Markets site is intuitive and easy to use, making it an ideal choice for beginners.