

What is Dow theory? The Dow theory is a form of technical analysis that states that the market is in an upward trend if one of its averages (such as transportation or industrials) rises above a prior significant high and is accompanied by or follows a comparable rise in the other average.
For instance, the Dow Jones Transportation Average (DJTA) is anticipated to follow the Dow Jones Industrial Average (DJIA) higher within a fair amount of time.
In this article, we will take a closer look at this fascinating theory, where it came from, and why it is such an important theory to gauge the health of the economy.
The Origin of the Dow Theory
The Dow theory was the brainchild of Charles H. Dow, who founded Dow Jones & Company, Inc. alongside Edward Jones and Charles Bergstresser. Together, they created the Dow Jones Industrial Average in 1896, which is a stock market index consisting of 30 prominent companies listed on the US stock exchanges.
Dow wrote about his theory in a number of editorials that were published in the Wall Street Journal, which he co-founded.
He maintained that the broader stock market provided a trustworthy reflection of the state of the economy’s general business environment, and by analysing the overall market, that it was possible to determine the direction of major market trends and individual stocks.
Unfortunately, Dow never released his complete theory due to his death in 1902, but several of his followers and associates have expanded on his theory over the years that followed.
How Does the Dow Theory Work?
The Dow theory is based on six basic principles:
1. The Market is Comprised of Three Trends
- Primary trends within a bull or bear market that can last anywhere from a year or more.
- Secondary trends such as corrections that move against the primary trend, which can last from three weeks to three months.
- Minor trends that generally last for less than three weeks.
Related Articles
2. Primary Trends Have Three Phases
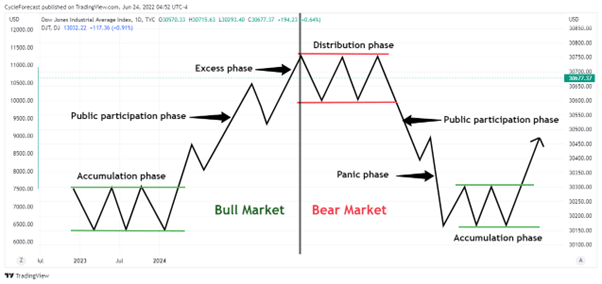
Image for illustration purposes only
- During a bull market: an accumulation phase, public participation phase, and excess phase.
- In a bear market: a distribution phase, public participation phase, and panic (or fear) phase.
3. The Averages Discount Everything
The efficient markets hypothesis (EMH), which claims that asset prices take into account all available information, underlies the Dow theory.
Factors such as earnings potential, competitive advantage, managerial skill, and other aspects that can affect stock prices are already priced into the market. Even future events are discounted in the form of risk, according to stricter interpretations of this idea.
4. The Averages Must Confirm Each Other
Dow stated that indices or market averages must confirm one another in order for a trend to be well established, meaning that signals that occur on one index, for example, should correspond or match the same signals on another index.
Traders should not assume that a new trend has started if one index, such as the Dow Jones Industrial Average (DJIA), is confirming a new primary uptrend, but another index, such as the Dow Jones Transportation Average (DJTA), remains in a primary downtrend.
This reasoning suggests that if producers’ revenues are increasing, they must be manufacturing more and be shipping more of their products to consumers.
The performance of the businesses that transport manufacturers’ output to markets, such as the railroads, might therefore be of interest to investors.
5. Volume Confirms the Trend
Dow believed that volume should increase during a primary trend and that low volume signalled weakness in a trend. For instance, during a bull market, volume should rise as price rises and decline during a secondary correction.
If volume, however, starts increasing during a correction, then it could be an early sign that market participants are turning bearish.
6. Trends Persist Until a Prominent Reversal Occurs
It is common to mistake primary trend reversals for secondary trends. Dow believed that during these reversals, the primary trend should be given the benefit of the doubt.
It can be challenging to determine whether a reversal heralds the start of a new trend or only a momentary change in the current trend. Regarding the precise timing of a trend shift, Dow theorists frequently differ. Although technical analysis tools try to make this clear, various investors may have different views and opinions.
Examples
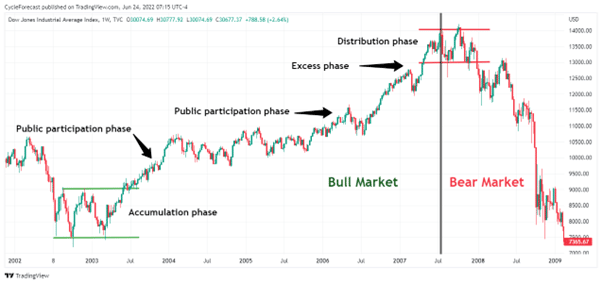
Image for illustration purposes only
The first chart example above shows the three phases of a primary trend that the Dow Jones Industrial Average Index (DJIA) went through, prior to the previous US recession that lasted from 2007 to 2009.
The resulting market collapse happened quickly, after the short distribution phase, and as the next chart example below will illustrate, there were early warning signs that this market was not in a ‘healthy’ state (according to the Dow theory) prior to the collapse.
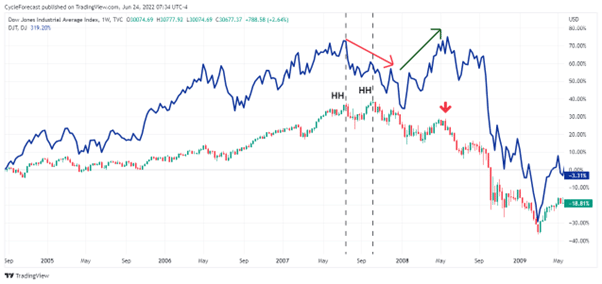
Image for illustration purposes only
The chart above shows the price action of the DJIA (weekly candlesticks) versus the DJTA (blue line). Note how these two indices almost mirrored each other perfectly leading up to the final highs before the market crash occurred.
This behaviour adhered to the part of the Dow theory that states that the averages should confirm each other.
However, while the DJIA continued to make higher highs (labelled HH), the DJTA started moving significantly lower (red arrow between two vertical black lines). Soon afterwards, the DJTA moved to new highs (green arrow), but the DJIA failed to follow suit and continued lower.
For a period that spanned multiple months, these two averages became ‘disconnected’ from each other, which signalled an ‘unhealthy’ market environment before the severe decline started in earnest.
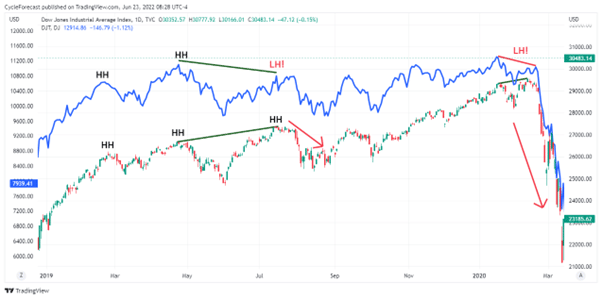
Image for illustration purposes only
Our final chart example shows the same behaviour discussed above but this time on two occasions that happened in 2019 and 2020. When the one index moves higher but the other fails to do the same, this is referred to as index divergence, which in many cases acts as an early warning that a reversal might be imminent.
Conclusion
Even though a lot has changed over the past century, many traders still regard the Dow theory with its six basic principles to be a reliable trading approach. The Dow theory provides the foundation for much of what we currently understand about technical analysis, which is why traders and investors alike should familiarise themselves with this fascinating theory.
The Dow theory, however, is not infallible, just like most theories and strategies in the world of trading. Dow’s theory was intended to help investors identify facts and not to make forecasts or assumptions about market direction.
Hopefully, this article has given you a deeper understanding of the different phases that markets go through and will spur you on to study this fascinating theory further.

Forextraders' Broker of the Month
BlackBull Markets is a reliable and well-respected trading platform that provides its customers with high-quality access to a wide range of asset groups. The broker is headquartered in New Zealand which explains why it has flown under the radar for a few years but it is a great broker that is now building a global following. The BlackBull Markets site is intuitive and easy to use, making it an ideal choice for beginners.