Forex technical analysis strategies aim to predict future prices on the basis of past developments. All that the technical analyst is interested is in the price, and news or data have no bearing on their decisions. In this article we will examine some of the basic concepts behind forex technical analysis strategies, and will attempt to summarize the main tools used by technical traders in breaking down price patterns.
The forex technical analysis strategy phases
As we noted technical analysis chooses to ignore everything except the price in its decisions. A forex technical analysis strategy will usually involve several phases, each clarifying some aspect of the price action, until a credible entry or exit point is determined. The phases for this are.
1. Identify the type of the market and the type of the trade
Needless to say, the first step in technical analysis must be the identification of the market with which the trader is interacting. After that they must determine the time period of the trade they will enter. What kind of charts will the trader use for their trade? Will it be a monthly trade, or an hourly one? If it’s a monthly trade, there’s no need to worry about the hourly changes in the price, provided that the strategy regards the present value as an acceptable monthly entry or exit point. Conversely, if the trade is for the short term, the trader may desire to examine charts of longer periods to gain an understanding of the bigger picture which may guide them with respect to their stop loss or take profit orders.
The trader will use trend lines, oscillators, and visual identification to determine the type of market that the price action is presenting. Strategies in a flat, ranging, or trending market are bound to contrast strongly with each other, and it is not possible to identify a useful strategy without first filtering the tools on the basis of the market’s character. Once this is done, and the time frame of the trade is determined, the second stage is –
2. Picking the technical tools
On the basis of the criteria discussed in the previous item, we must pick the appropriate technical tools for the chart we examine. If the market is trending, there’s little point to using the RSI. If it’s ranging, the moving averages are unlikely to be of much use. If the underlying currency pair is strongly cyclical (for example, if the currency is issued by a commodity exporting nation) the commodity channel index could be a good choice. If it is highly volatile, smoothing out the fluctuations with moving average crossovers could be very beneficial for identifying the trend.
Of course the list can be extended. The trader must refine their approach to trade over time by deciding on the kind of indicators which they understand best, and then combining them later to form a simple and concise method.
3. Refine the periods, and other inputs
Upon deciding on the technical tools, the analyst must decide on the periods, and ranges for which values must be supplied to the software. Today’s traders have many advantages over those in the past, but diligence and patience may not be one of those. As we’re so used to having everything automated and performed by the computer with no questions asked, many don’t even bother to tinker with the minutiae that can in fact be all the difference between success and failure for the trader’s analysis.
Thus, before going any further, the trader must check which periods, which values provide the pattern that is most fitting for the price action on the chart. For example, for the RSI, will we pick a period of 14, 10, or 7 for the chart we examine? Or what will be the periods of the moving averages that constitute the MACD indicator? These can only be answered through trial and error, and for each price pattern, a different value may be necessary.
4. Seek the signals
Once the technical tools are setup, we must now seek the signals that will show us the trade opportunities created by investor sentiment and temporary imbalances in the supply and demand for a currency pair. The signals that we seek are the ones created by the interaction between a number of indicators, such as that between moving averages, various oscillators, or between the price and the indicator. Our purpose is to confirm our ideas with various aspects of technical analysis. If there’s an oversold or overbought level, we will confirm it with a divergence/convergence. If there’s a breakout, we will seek to ascertain it with studies of crossovers.
We will examine the signals in greater detail a bit later, but in summary they are channels, crossovers, divergence or convergences, breakouts, consolidation patterns, the various price patterns like triangles, flags, and head and shoulders. We will keep our indicators simple, but we will make sure that the signals generated by them are examined and exploited to the full, allowing us to draw a complete picture of the price action.
5. Perform the analysis
After deciding on the signals and their meaning, we will perform our analysis by identifying actionable signals, and deciding on capital allocation in light of proper money management techniques. When analyzing the data we must make our utmost exertion to ensure that we focus on signals relevant to our selected period and trading plan. This stage of analysis will involve the separation of wheat from chaff, and data from noise.
6. Compare the results, execute the trade
After examining the various scenarios presented by the charts, and determining on which of them are actionable, the trader will compare them in terms of credibility and profit potential (for example, how extreme are the indicator values, how much profit or loss will be generated in case a take- profit or stop-loss order is realized?) Once that is done, they will pick the trade that offers the highest returns with the lowest risk on the basis of the technical scenario that is the most contrarian.
What the above implies is that, when a trend follower trades, they will wait for the corrections, acting on a contrarian basis to the short term movement, while conforming to the main trend. When they desires to bet against the trend, they will await the most extreme valuations generated by the trend, and when the momentum is highest, they will make a contrarian bet at the first credible reversal.
Forex signals
A forex technical analysis trading strategy is created by using many different types of price phenomena that are manifested on many different kinds of indicators. We will examine strategies later, but at this stage let us examine the signal types that are used to create them.
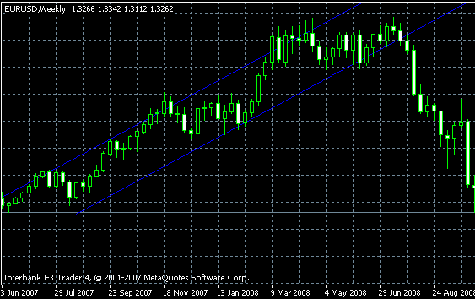
1. Channels
Channels are two parallel trend lines that constrain the price action in opposite directions. The upper line prevents bullish breakouts, while the lower line checks the bearish ones. A channel is a very regular formation, and offers great potential for realizing a profitable trade, but it’s also relatively rare.
Channels are used to generate signals that help us identify breakout points. If the indicator used to analyze the channel stayed above or below a certain level for a long period of time, a breakout can be confirmed by excessive values. But given how regular and controlled the price movement must be while inside a channel, the trader can devise many other ways of trading it, and some of their methods can be based on fundamental analysis too.
The existence of a channel will allow the trader to use other tools, such as overbought, oversold indicators, to generate additional signals. A channel also signals that market participants are expecting a major development to decide the direction of the trend, and that the trader must be alert about potential.
2. Crossovers
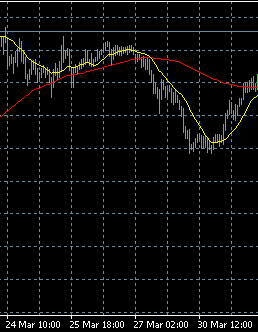
Crossovers occur when one indicator’s value suddenly rises or falls below that of another one which is used as a signal line. Crossovers signal momentum change in the market, and are often used to generate trade signals that are more reliable than those indicated by single indicators.
In the hourly chart of AUD/USD we see the 14-day moving average shown by the yellow line falling below the 100- day moving average shown by red, and we notice that the price later made a major move in the same direction. Crossovers are not limited to one type of indicator, and of course, the trader can use them in many different situations for analyzing price patterns.
The disadvantage with crossovers is born of the fact that they’re fairly common, and thus prone to generate conflicting and false signals. Unless confirmed by other, more reliable phenomena like divergence/convergence, the trader should be cautious about regarding the crossover as an actionable signal.
3. Breakthroughs, breakouts
This signal is generated when a range or a consolidation pattern breaks down, allowing the price to move violently and rapidly in the direction of the breakout. Potential breakouts are identified first by direct visual examination (for instance, an uptrend is fluctuating around a price level for a prolonged period ), and then confirmed by the behavior of indicators (a very calm MACD registering strong values, or an moving average crossover).
A consolidation occurs when a trend fluctuates around a value for a relatively long period without jeopardizing its strength. A breakout is when a range pattern breaks down, and the price action is no longer constrained. A breakthrough is the situation where a previously strong resistance level is breached by an ongoing trend.
Consolidation, breakout and breakthrough may all occur on the price chart, or on the indicators themselves. The interpretation will differ depending on the significance of the levels breached (for example, the price breaking through a multi-year resistance line is more important than the RSI reaching a previously unbreached level.)
False breakouts are relatively common in the markets, and many traders try to avoid them by getting into the trade when the breakout is going through its correction phase. Deciding on the nature of a breakout will of course depend on probability analysis. Experience, and proper money management methods are our best friends.
4. Divergence/convergence
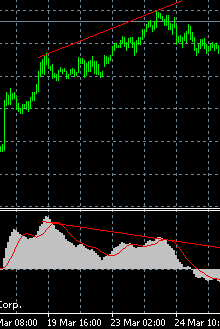
The tendency of all indicators to create false signals is well-known among technical traders, and to overcome this problem, traders have been looking at divergences between indicators, or between an indicator and the price for quite some time. Convergence occurs when successive values of two indicators are closer to each other with the passage of time. Divergence occurs when the values are farther apart as time passes. In both cases, the principle behind convergence/divergence dictates that the indicators make movements in opposing directions, and the phenomenon is used to signal that the ongoing trend is getting weaker.
In the above example of AUD/USD, we see that the MACD is making lower values even as the price keeps getting higher. In other words, the price action is not only confirmed, but contradicted by the indicator. Traders seek these signals to decide on opportunities that offer a greater risk-reward potential.
5. Price patterns
Price patterns, such as triangles, head and shoulders, pennants, flags can all be used to identify a potential trade, or at least be used to signify an emerging opportunity. These patterns all have different ways of being interpreted, but the seasoned analyst is unlikely to move on any of them without receiving a confirmation from a secondary source, such as an indicator. We will examine the patterns in detail later.
Conclusion
Forex technical analysis strategies are created by the combination of the above signals and patterns. It is a good idea to combine signals of indicators with price patterns to receive more reliable indications on a potential trade. For example, an MACD crossover after a major counter-trend move can be much more reliable as a trade signal than any value of the MACD, however extreme it may be. In a major triangle movement, a divergence or convergence between the RSI and the price can be far more reliable than the extremes registered on the indicator.
In short, instead of absolute values, the technical analyst will choose to focus on the rarer phenomena which we just discussed. In following chapters of this section, we will discuss technical strategies in greater detail.
Go back to the technical analysis section.
Read more about the RSI indicator.
Read more about the MACD indicator.
Learn more about well known technical patterns.

Forextraders' Broker of the Month
BlackBull Markets is a reliable and well-respected trading platform that provides its customers with high-quality access to a wide range of asset groups. The broker is headquartered in New Zealand which explains why it has flown under the radar for a few years but it is a great broker that is now building a global following. The BlackBull Markets site is intuitive and easy to use, making it an ideal choice for beginners.