
Our trading signal analysis is based on a comprehensive summary of market data. We use a range of metrics with weighting given to simple and exponential moving averages and key technical indicators.
We created this Weekly Tips section to share possible trade entry and exit points based on technical analysis. We also have other methods of validating our trades which we can’t publicly share that help to increase their success. All our trades include entry and at least one target price. Stop losses are applied at the reader’s discretion. Our strategies typically trade with a wide stop loss and risk is further mitigated by trading in small sizes.
Instrument | Hourly | Daily | |
EUR/USD | 1.1321 | Sell | Sell |
GBP/USD | 1.3576 | Sell | Strong Buy |
USD/JPY | 115.77 | Neutral | Strong Buy |
S&P 500 | 4,677 | Strong Sell | Neutral |
NASDAQ 100 | 15,598 | Strong Sell | Strong Sell |
FTSE100 | 7,480 | Strong Buy | Strong Buy |
Gold | 1,792 | Strong Sell | Strong Sell |
Crude Oil WTI | 78.65 | Strong Buy | Strong Buy |
Bitcoin | 41,866 | Neutral | Strong Sell |
Ethereum | 3,152 | Neutral | Strong Sell |
UTC 09:18
FOCUS ON: INFLATION AND JOBS DATA
Risk-on assets spent most of the last week giving up gains made over December. Disappointing jobs numbers out of the US saw new hires for the previous month total 199,000 rather than the expected 422,000. At the same time, a more hawkish interpretation is being given to guidance from the US Federal Reserve.
The Weekly Forex Trading Tips report of 4th January had highlighted the chance of a pullback in the markets as December’s price spike wasn’t supported by increased trading volumes. With some markets, such as the Nasdaq 100, now more than 5% off the levels at which they started the year, the question is whether this is a dip to buy or part of a more substantial paradigm shift.
Indices
Nasdaq 100
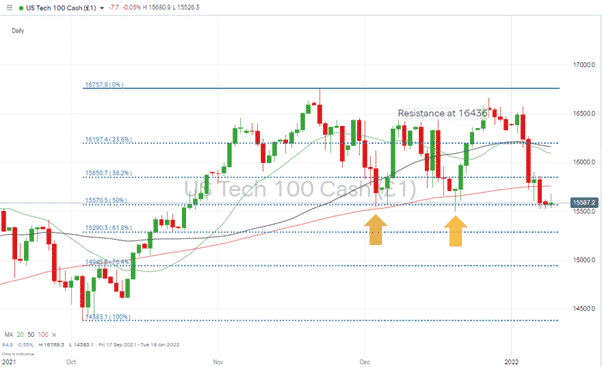
Tech stock prices tumbled on the back of inflationary fears, and the price of the Nasdaq 100 index smashed through the 20, 50 and 100 Daily Simple Moving Averages in the space of two days. Perma-bulls had few opportunities to trade retracements, but the price is now finding support from the 50% Fib retracement level at 15,570. The lows of 3rd and 20th December, 15,539 and 15,501, are also coming into play.
Nasdaq 100 Daily Chart – 50% Fibonacci Retracement Acting as Support
Source: IG
Long positions
- Entry Level 1: 15,600 – Psychologically important price level and December low. A break of this would constitute a short-term bearish pattern being formed.
- Price Target 1: 15,759 – In the region of 100 Daily SMA
- Price Target 2: 15,850 – 38.2% Fib retracement
- Stop Loss: < 15,500
Short positions
- Entry Level 1: 15,600 – Using the psychologically important price level and December low as a pivot and trading to the downside.
- Price Target 1: 15,500 – December low (swing low) and ‘big number’ support level.
- Price Target 2: 14,631 – In the region of 50 Weekly SMA
- Stop Loss: 15,759 – In the region of 100 Daily SMA
S&P 500
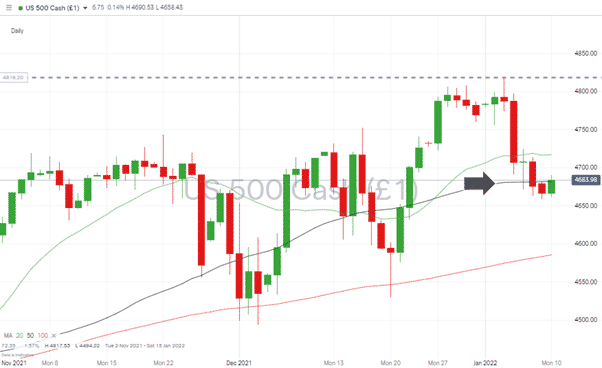
The S&P 500 held up better than the Nasdaq but still gave up more than 2.5% in value during the first trading week of the year. Friday’s disappointing jobs numbers took the price to the region of the 50 Daily SMA, where it has found support.
S&P 500 Daily Chart – Finding Support at Key Price Level
Source: IG
Long positions
- Entry Level 1: 4,682 – In the region of the 50 Daily SMA
- Price Target 1: 4,717 – In the region of the 20 Daily SMA
- Stop Loss: 4,640 – 61.8% Fib retracement
Short positions
- Entry Level 1: 4,673 – 50% Fib retracement
- Price Target 1: 4,640 – 61.8% Fib retracement
- Price Target 2: 4,600 – Big number price support
- Stop Loss: >4,682 – In the region of the 50 Daily SMA
FTSE 100
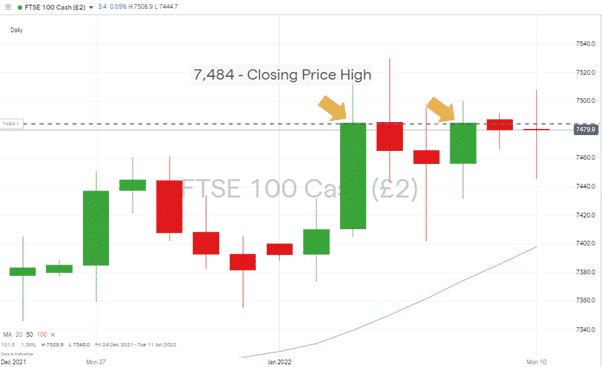
The UK’s benchmark index has, over the last week, posted two 12-month-high closing prices of 7,484. Each time the following trade session was marked by price weakness, but a close above that level would point to the path of least resistance being upwards.
FTSE 100 Daily Chart – Closing Price of 7,484 Providing Resistance
Source: IG
Long positions
- Entry Level 1: 7,484 Using a close above 7,484 as part of a breakout strategy.
- Price Target 1: 7,693 – January 2020 and 24-month price high
- Stop Loss: 7,400 – In the region of 20 Daily SMA and psychologically important price level
Forex
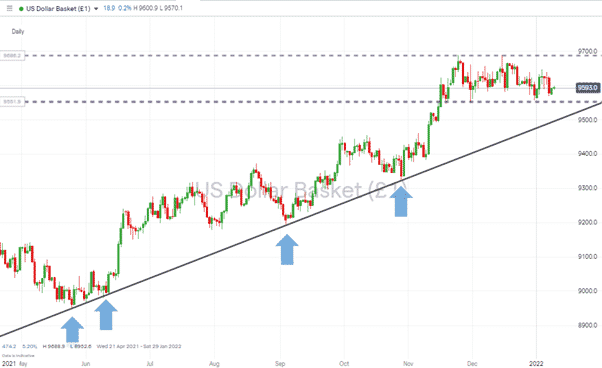
The US Dollar Basket index has a trendline dating back to May 2021. It has acted as support on three occasions – in June, September, and October 2021. The newly formed sideways channel would intersect the trendline support in the region of 9550. Should that happen, it can be expected to be a point at which buyers step in in size. There are no guarantees they’ll end up being proved right, but it’s a clear technical indicator that a lot of the market will be following, and that will influence all the USD currency pairs.
US Dollar Basket Index Daily Chart – Long Term Trendline Support & Sideways Channel
Source: IG
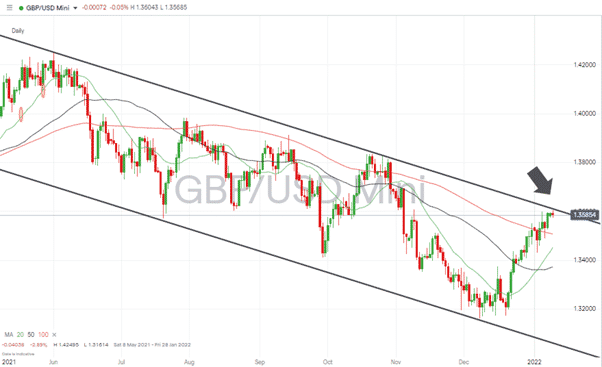
GBPUSD
It will be make or break time for cable. Will sterling be able to break out of its long-term downward channel, or is this a chance to sell at the top of the range?
GBPUSD – 1D chart – Long-term downwards channel still holds
Source: IG
Long positions
- Entry Level 1: 1.36 – In the region of the upper trend line of the downwards channel. Breakout strategy.
- Price Target 1: 1.424 – Price high of June 2021
- Stop Losses: 1.35 – In the region of former resistance trend line converted to supporting role and 100 Daily SMA
Short positions
- Entry Level 1: 1.36 – In the region of the upper trend line of downwards channel. Downwards channel strategy.
- Price Target 1: 1.35 In the region of 100 Daily SMA
- Price Target 2: 1.31 – In extension, big number price level and bottom of downwards channel
- Stop Losses: > 1.370 – Big number price level which is above downwards channel
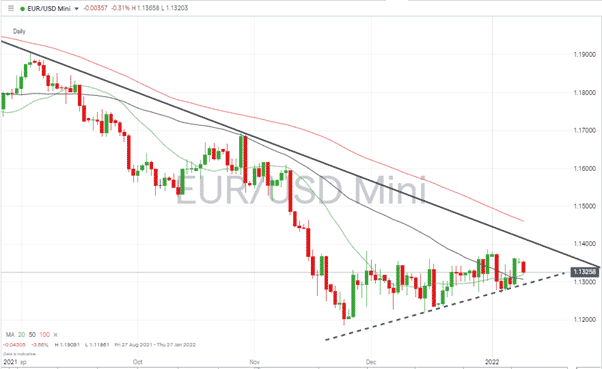
EURUSD
Price is funnelling into the end of a sideways wedge pattern. With US interest rate policy turning hawkish and the ECB remaining dovish, the fundamental factors in play suggest a further downward move could be likely.
EURUSD – 1D chart – Consolidation in a Rising Wedge pattern
Source: IG
Short positions
- Entry Level 1: 1.138 – 1.140 – Upper trend line resistance of wedge pattern
- Price Target 1: 1.132 – In the region of 20 Daily SMA
- Price Target 2: 1.130 – Current level of supporting trend line
- Stop Losses: >1.140 – Big number resistance level
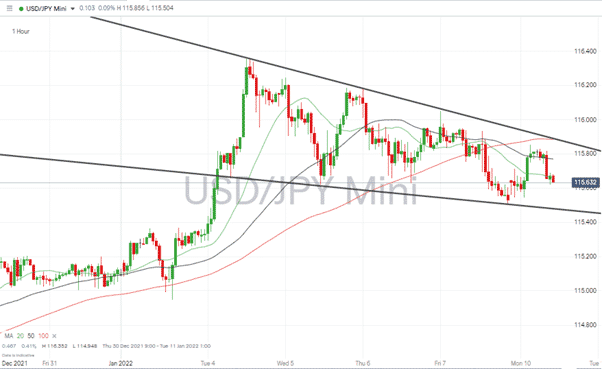
USDJPY
After a steep price rise in the opening sessions of the year, USDJPY has begun to form a downwards wedge pattern. The currency pair tends to follow price moves with periods of range-bound trading, so scalping within the channel could be a short-term option.
USDJPY – 1H chart – Downwards Wedge Pattern Forming
 Source: IG
Short positions
- Entry Level 1: 115.87 – In the region of the upper trend line
- Price Target 1: 115.47 – In the region of the lower trend line
- Stop Losses: > 115.87 – Above the resistance trendline
Long positions
- Entry Level 1: 115.47 – In the region of the lower trend line
- Price Target 1: 115.87 – In the region of the upper trend line
- Stop Losses: < 115.47 – Below the support trendline
Crude Oil (WTI)
After more than 12 months of bullish price action, Crude could be forming a consolidation pattern. The swing lows of 2nd December and 22nd August 2021 have held, and the outcome of last week’s OPEC meeting has stirred a price to move in the direction of the $85.06 high of October.
Crude Oil (WTI) Daily Chart – Sideways Pattern Forming?

Source: IG
Short positions
- Entry Level 1: 85.00 October and 12-month price high
- Price Target 1: 76.10 – In the region of the current level of 100 Daily SMA
- Price Target 2: 73.85 – In the region of the current level of 50 Daily SMA
- Price Target 3: 61.73 – Swing Low of 1st August
- Stop Loss: > 85.00
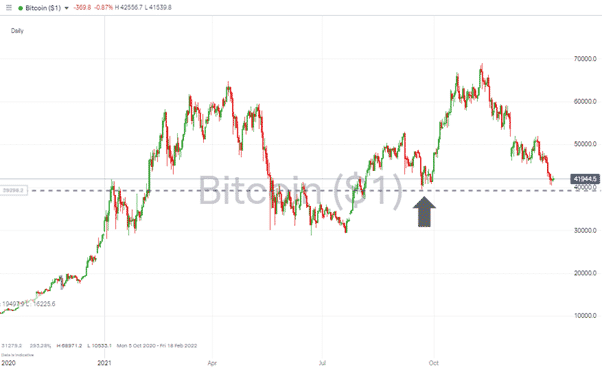
Crypto – Bitcoin and Ethereum
Price weakness in Bitcoin and Ethereum has gained new momentum, with fresh price support levels coming into play. Autumn’s swing lows in both markets could be tested. Bitcoin is already near that key price level, but Ether has some way to go.
Bitcoin – 1D price chart – Test of Swing Low
Source: IG
Bitcoin Long positions
- Entry Level 1: 40,000 – Big number price support
- Entry Level 2: 39,612 – Swing low of 21st September 2021
- Price Target 1: 50,000 – Psychologically important ‘big number’ resistance level
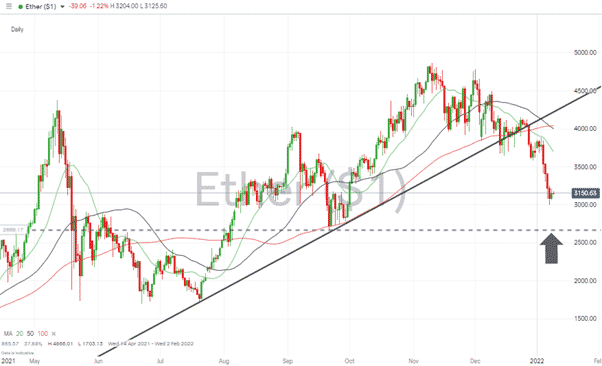
Ethereum – 1D price chart – Downwards wedge pattern forming
Source: IG
- Ethereum Long positions
- Entry Level 1: 2,652 – Swing low of 21st September 2021
- Price Target 1: 3,000 – Psychologically important ‘big number’ resistance level
Risk Statement: Trading financial products carries a high risk to your capital, especially trading leverage products such as CFDs. They may not be suitable for everyone. Please make sure that you fully understand the risks. You should consider whether you can afford to take the risk of losing your money.

Forextraders' Broker of the Month
BlackBull Markets is a reliable and well-respected trading platform that provides its customers with high-quality access to a wide range of asset groups. The broker is headquartered in New Zealand which explains why it has flown under the radar for a few years but it is a great broker that is now building a global following. The BlackBull Markets site is intuitive and easy to use, making it an ideal choice for beginners.