
Our trading signal analysis is based on a comprehensive summary of market data. We use a range of metrics with weighting given to simple and exponential moving averages and key technical indicators.
We created this Weekly Tips section to share possible trade entry and exit points based on technical analysis. We also have other methods to validate our trades which we can’t publicly share that help to increase their success. All our trades include entry and at least one target price. Stop losses are applied at the reader’s discretion. Our strategies typically trade with a wide stop loss, and risk is further mitigated by trading in small sizes.
Instrument | Price | Hourly | Daily |
EUR/USD | 1.1165 | Strong Buy | Strong Sell |
GBP/USD | 1.3424 | Strong Buy | Strong Sell |
USD/JPY | 115.45 | Strong Buy | Strong Buy |
S&P 500 | 4,438 | Strong Buy | Strong Sell |
NASDAQ 100 | 14,486 | Strong Buy | Strong Sell |
FTSE100 | 7,523 | Strong Sell | Buy |
Gold | 1,788 | Neutral | Strong Sell |
Crude Oil WTI | 87.29 | Strong Buy | Strong Buy |
Bitcoin | 36,933 | Strong Sell | Strong Sell |
Ethereum | 2,506 | Strong Sell | Strong Sell |
UTC 09:52
FOCUS ON: Trading Opportunities In A Week Packed Full Of News Announcements
News releases over the next five days look set to create some trading opportunities. The US Fed’s interest rate announcement of last week is set to be followed by updates from the central banks of the UK, the eurozone and Australia. Each one of those has the potential to cause ‘aftershocks’ in all asset groups.
On Friday, January’s US Non-Farm Payroll job numbers will be shared with the markets, and corporate earnings updates for Q4 2021 will continue to feed into the markets throughout the week.
Indices
Nasdaq 100
US tech stock prices are in the process of adjusting to two major price drivers. The threat of inflation and interest rate hikes offer a genuine risk that future consumer spending could be cut whilst the earnings results for the last quarter continue to throw up surprises.
Peloton’s disappointing earnings update was followed on Thursday by a set of numbers released by Apple, which showed sales were still surging. When the largest tech firm in the world posts record earnings, there can be some kind of a lift expected in the sector, and prices rallied hard into the end of the week.
The hourly chart for last week highlights how the Nasdaq 100 index was almost unchanged over the week despite at one point being 4.79% down in value. Five failed tests of the 14,425-price resistance level point to there still being concern over the valuation of tech stocks.
Nasdaq 100 Chart – 1hr Candles 24th – 31st January – Five Failed Breakouts
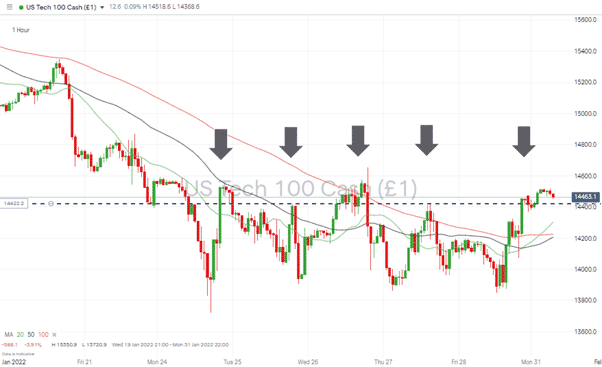
Source: IG
Highlighting the stick or twist nature of the situation, support is being offered by longer-term metrics, most notably the 20 Month SMA (13,510). That was almost clipped on Monday, 24th January and was highlighted as a buying opportunity in the Forex Trading Tips report of 24th January. The 23.6% Fibonacci Retracement of the March 2020 bull run offers additional support, which sits at 14,379.
Nasdaq 100 Chart – Monthly Candles with Fib Retracement and SMAs
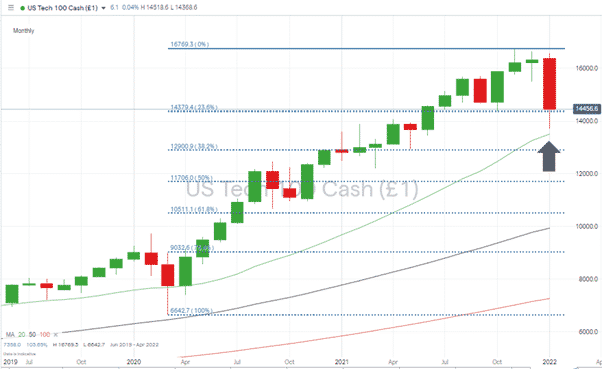
Source: IG
Short positions
- Entry Level 1: 14,425 – This price level acted as resistance on five different occasions last week. A breakthrough to the downside would signal that bears are still controlling the market.
- Price Target 1: 14,383 – Price low of week of 4th October 2021. If the price moves below this swing-low, it will create a bearish price pattern.
- Price Target 2: 13,510 – Current price of 20 SMA on Monthly chart
- Stop Loss: 14,985 – Current price of 20 SMA on Daily chart
Long positions
- Entry Level 1: 14,425 – This price level acted as resistance on five different occasions last week would represent significant support if upward price moves can find momentum.
- Price Target 1: 14,983 – Current price of 20 SMA on Daily chart
- Stop Loss: < 14,379 – 23.6% Fibonacci Retracement
S&P 500
The S&P 500 index has unsurprisingly posted similar price moves to the Nasdaq 100 index, so it also looks pitched to move in either direction when the big news events of the week begin to come into play.
Whilst price moves in the two indices were similar, the S&P 500 showed marginally more strength than the Nasdaq, suggesting if one of the indices was going to be tipped to rebound, it could be this one.
S&P 500 Hourly Chart – 24th – 31st January – Five Failed Breakouts
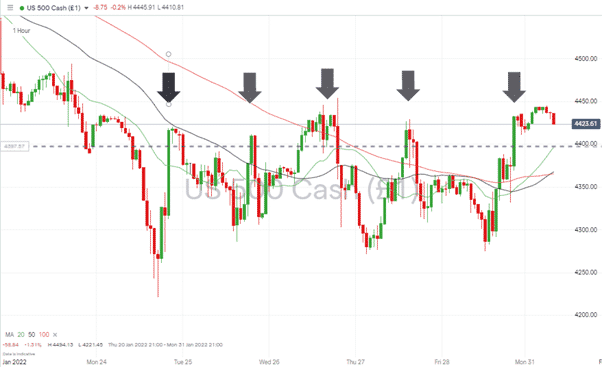
Source: IG
Short positions
- Entry Level 1: 4,389 – Closing price of 21st January, which acted as resistance on five different occasions in the week beginning 24th January. A breakthrough of it to the downside would confirm that bearish sentiment still dominates the market.
- Price Target 1: 4,270 – Price low of week of 27th September 2021. If price moves below this swing-low, it will confirm a bearish price pattern.
- Price Target 2: 4,368 – Current price of 50 SMA on Weekly price chart
- Stop Loss: 4,530 – Current price of 20 SMA on Daily chart
Long positions
- Entry Level 1: 4,389 – Using the resistance price level as a support indicator should price retreat to clip it.
- Price Target 1: 4,530 – Current price of 20 SMA on Daily chart
- Stop Loss: < 4,221 – Month to date low and 23.6% Fibonacci Retracement from March 2020 price lows.
FTSE 100
The UK’s benchmark index posted an approximate 1% gain last week as investors opted for the banking, oil and mining stocks, which make up a large percentage of its constituent parts.
FTSE 100 Hourly Chart – Supporting Trend Line
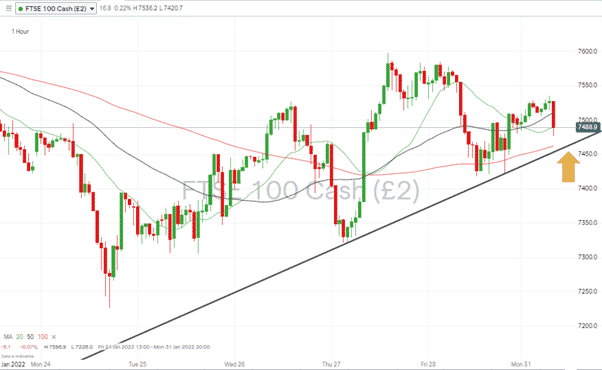
Source: IG
Long positions
- Entry Level 1: 7,460 – The Bank of England is expected to increase interest rates on Tuesday, so short-term price volatility could lead to the price of the FTSE retreating to test the supporting trend line.
- Price Target 1: 7,596 – Price high of Thursday 27th January
- Stop Loss: 7,405 – below the 50 SMA on the Daily price chart and near the psychologically important price level of 7,400.
Forex
GBPUSD
The market is pricing in a 90% probability of the Bank of England raising interest rates on Tuesday. Any surprise holding of rates at current levels would send sterling tumbling. Even though the rate hike is already priced in, the pound has lost ground to the US dollar over the last week.
GBPUSD – Daily chart – Price returns to trade in long-term downwards price channel
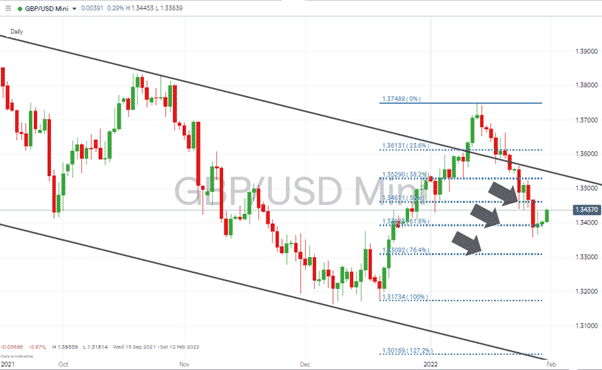
Source: IG
Short positions
- Entry Level 1: 1.34611 – Level of 50% Fibonacci Retracement of the bull-run from 20th December 2021 to 13th January 2022
- Price Target 1: 1.3300 – Psychologically important ’round number’ price level in the region of 76.4% Fibonacci retracement level (1.3393)
- Stop Losses: 1.355 – Using the upper trend line of the long-term downwards price channel.
EURUSD
Whilst the US and UK central banks are adopting a more hawkish stance on interest rates, the European Central Bank has given fewer hints that eurozone monetary policy might be tightened. This odd-one-out position could signal further euro weakness based on the weaker fundamentals of the EU economy.
EURUSD – Weekly chart – 20 SMA guiding EURUSD down
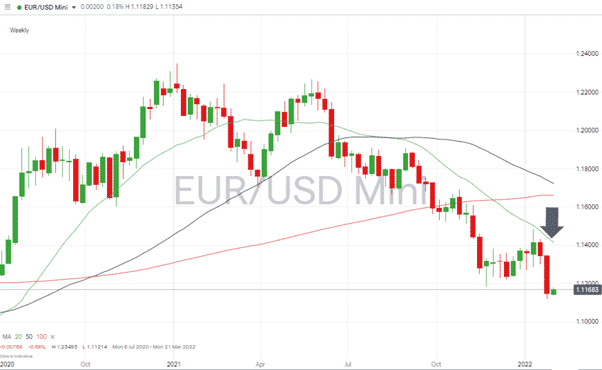
Source: IG
Short positions
- Entry Level 1: 1.130 – ‘Big number’ price level and region of downwards trend line identified in Forex Trading Tips report of 24th January.
- Entry Level 2: 1.14150 – Selling into any EUR strength and using the 20 SMA on the Weekly price chart as an indicator.
Crude Oil (WTI)
Oil had a good week and was up +2%, thanks to geopolitical tensions relating to Russian gas and oil supplies. It has failed to break above the high of $85.06 printed in October of last year, suggesting it could give up some ground or consolidate at this higher level. A flare-up on the Russia-Ukraine border is the most likely catalyst for further price rises from here.
Crude Oil (WTI) Daily Chart – Finding Resistance at Top of Trading Channel
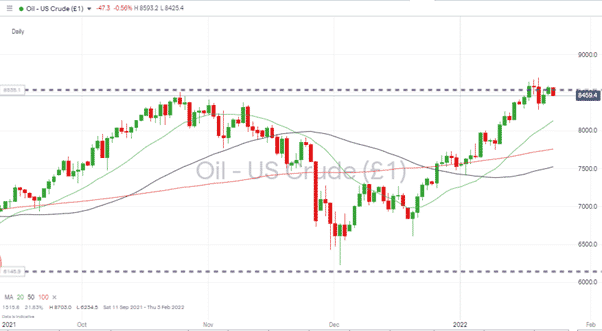
Source: IG
Long positions
- Entry Level 1: 85.06 Price high of October 2021, and also the 24-month price high. Breakout strategy supported by fundamental economic factors.
- Stop Loss: < 82.72 – Lowest price recorded on Thursday 20th January.
Crypto – Bitcoin & Ethereum
Both of the big crypto coins experienced a price bounce last week. The question is whether this is price consolidating or a pause before another drop. Interest rate decisions appear to be weighing on the coins as they threaten the supply of cheap cash used for more speculative strategies. The central bank announcements due this week could determine which way price heads.
Bitcoin – Daily price chart – Trend Line Resistance Coming Into Play
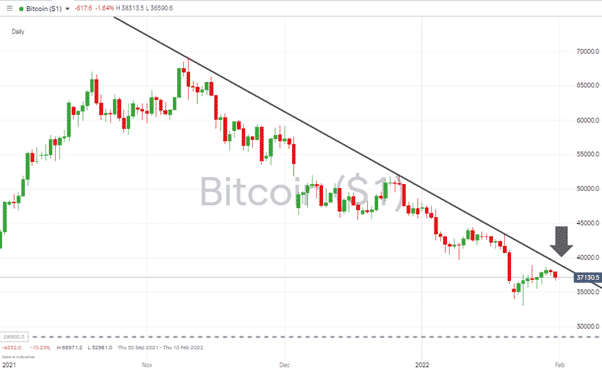
Source: IG
Bitcoin Long positions
- Entry Level 1: 39,000 – Trading a breakout strategy should BTC be able to push through the downwards resistance trend line.
- Stop Losses: 32,981 – Price low of 24th January, also the year-to-date low.
Ethereum – 1D price chart – New Short-term Trend Line Forming
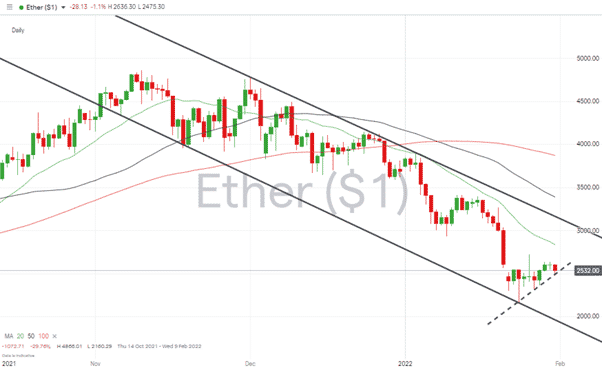
Source: IG
Ethereum Long positions
- Entry Level 1: 2,500 – Big Trading a breakout strategy should BTC be able to push through the downwards resistance trend line.
- Entry Level 2: 2,480 – Using the recently formed supporting trend line from 24th January.
- Price Target 1: 3,000 – Psychologically important ’round number’ price level in the region of upper end of downwards resistance trend line
- Stop Losses: – 2,160 – Price low of 24th January, also the year-to-date low.
Risk Statement: Trading financial products carries a high risk to your capital, especially trading leverage products such as CFDs. They may not be suitable for everyone. Please make sure that you fully understand the risks. You should consider whether you can afford to take the risk of losing your money.

Forextraders' Broker of the Month
BlackBull Markets is a reliable and well-respected trading platform that provides its customers with high-quality access to a wide range of asset groups. The broker is headquartered in New Zealand which explains why it has flown under the radar for a few years but it is a great broker that is now building a global following. The BlackBull Markets site is intuitive and easy to use, making it an ideal choice for beginners.