
Instrument | Price | Hourly | Daily |
EUR/USD | 1.0868 | Strong Sell | Strong Sell |
GBP/USD | 1.3173 | Strong Sell | Strong Sell |
USD/JPY | 114.91 | Neutral | Strong Sell |
S&P 500 | 4,250 | Strong Sell | Strong Sell |
NASDAQ 100 | 13,586 | Strong Sell | Strong Sell |
FTSE100 | 6,822 | Strong Sell | Strong Sell |
Gold | 1,997 | Strong Buy | Strong Buy |
Crude Oil WTI | 121.81 | Strong Buy | Strong Buy |
Bitcoin | 37,927 | Strong Sell | Strong Sell |
Ethereum | 2,518 | Strong Sell | Strong Sell |
UTC 09:52
FOCUS ON: Is The Market Oversold And How To Buy into Short-term Retracement Rallies
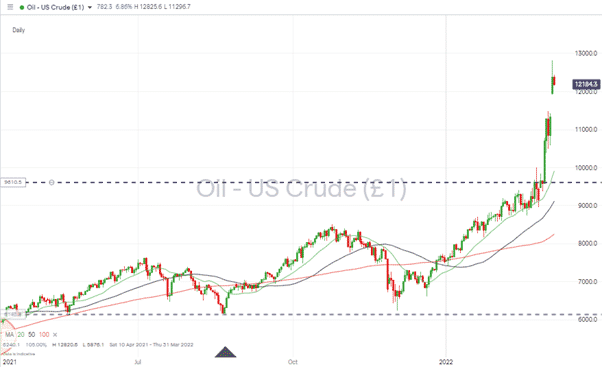
Welcome to extreme market volatility. Cryptos may be associated with dramatic price swings, but over the last week, the change in the price of Bitcoin (-1.09%) has been outstripped by traditionally more conservative markets such as the FTSE 100 (-7.91%), EURUSD (-2.68%) and gold (+5.27%). Crude oil prices have set the tone and created a lot of noise thanks to the price per barrel skyrocketing by about almost 30% in the space of one week.
Crude Oil – Daily Price Chart – Extreme volatility
Source: IG
Price charts in risk-on assets continue to hold their bearish patterns, with lower highs and lower lows since the start of the year pointing to the path of least resistance continuing to be downwards.
Traders with a contrarian approach will be studying the technical indicator chart and asking the question – wasn’t there a rally the last time that everything was marked as ‘Strong Sell’? Even with this medium to a long-term downward trend in place, some are finding opportunities to trade short-term rallies. Given the dramatic moves taking place, strategies being used in the current market come with severe risk warnings, but the trading ideas below pick out the key indicators to look out for.
An in-depth breakdown of the term oversold can be found here. It refers to market conditions where an asset has been sold off and has the potential for a price bounce. Oversold conditions can last for a long time, which means a market being oversold doesn’t directly equate to a price rally being imminent. Many technical indicators identify oversold and overbought levels but using them in conjunction with other indicators such as trading volumes can help determine when short-term price reversals might occur.
Our trading signal analysis is based on a comprehensive summary of market data. We use a range of metrics with weighting given to simple and exponential moving averages and key technical indicators.
We created this Weekly Tips section to share possible trade entry and exit points based on technical analysis. We also have other methods to validate our trades which we can’t publicly share that help to increase their success. All our trades include entry and at least one target price. Stop losses are applied at a reader’s discretion. Our strategies typically trade with a wide stop loss, and risk is further mitigated by trading in small sizes.
Indices
NASDAQ 100
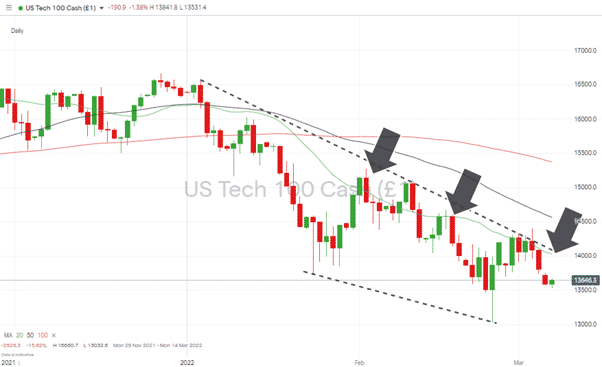
On the daily charts, price action in the Nasdaq 100 continues to form bearish patterns. Despite several short-term displays of bullish sentiment, the downward channel is holding its shape. A move above the upper resistance trend line could signal a chance to get into a long-term breakout strategy, but until that occurs, bulls might do well to approach the market with caution.
Nasdaq 100 Chart – 1Day Candles – 20 Day SMA providing resistance during price rallies
Source: IG
Despite massive selling pressure at the end of last week, the Nasdaq is still trading above the 13,032 low of Thursday 24th February. Given that the bearish pattern is still holding and fundamentals are weakening the question is whether the index could test or break below 13,000?
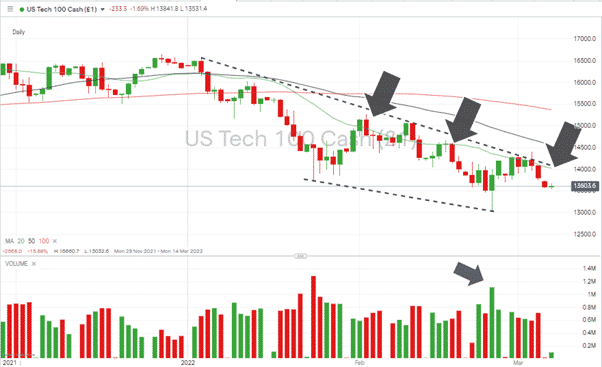
Nasdaq 100 Chart – 1Day Candles – Trading Volumes
Source: IG
Last week, trade volumes were at consistent levels, suggesting investors were forming a relatively orderly queue to leave the market. Any spike in daily activity would act as a supporting indicator for any price move, whether up or down.
Long positions
- Entry Level 1: 13,506 – Year to date closing low printed on 23rd February.
- Entry Level 2: 13,056 – Year to date intraday low printed on 24th February.
- Price Target 1: 14,023 – Region of 20 SMAs on Daily chart. This indicator has repeatedly acted as resistance to bullish retracements in price.
- Price Target 2: 15,276 – In extension, month to date high for February and one of the tops of the double-top formation discussed here.
- Stop Loss: < 13,000– Psychologically important “round number” price level. A relatively tight stop loss would minimise losses if the downward price move picked up momentum and developed from a sell-off into a full-blown market panic.
FTSE 100
The FTSE’s massive sell-off has tallied with international investors favouring the relative security of US markets. The large number of oil giants in the index has become a hindrance rather than a benefit. The skyrocketing rise in the price of crude has been counterbalanced by political pressure on oil transportation and supplies. That has impacted the share prices of FTSE members BP and Shell.
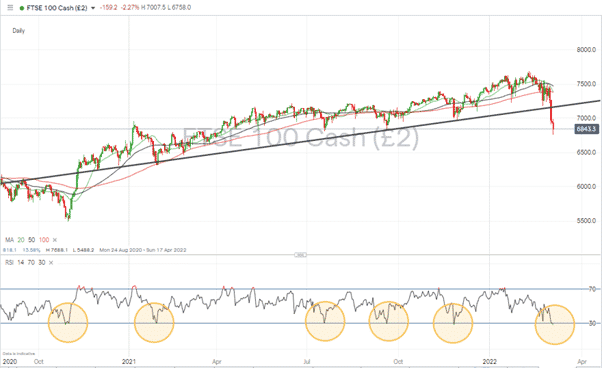
The Daily RSI has clipped and broken below 30, which on a price chart dating back to September 2020 has resulted in a short-term price bounce on five previous occasions.
FTSE 100 Daily Price Chart – Daily RSI is oversold … again.
Source: IG
Long positions
- Entry Level 1: 6,850 – Using RSI of <30 as an indication that the FTSE is currently oversold on a daily time frame.
- Price Target 1: 7,168 – Region of supporting trend line dates back to September 2021.
- Stop Loss: < 6,759 – Year to date price low of 7th March and region of 20 SMA on Monthly price chart (6,777).
Forex
Forex price moves continue to be driven by events in Ukraine. Given the geographical proximity of eurozone countries to the conflict, the move into the relative security of the US dollar has been most prominent in the euro, which is down 2.68% on a weekly time frame.
USD Basket Index – Daily chart – Long-term supporting trend line
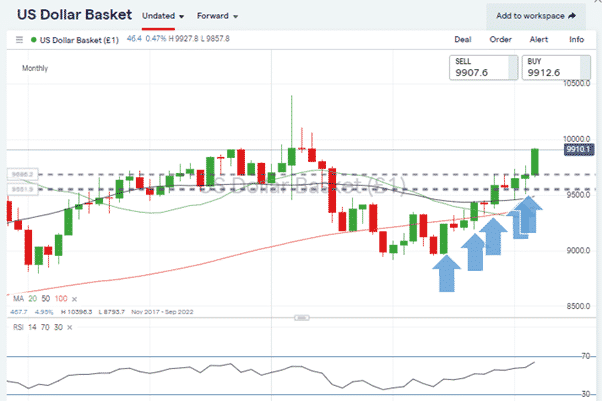
Source: IG
The US Dollar Basket index continues to climb, and after trading as low as 90 in June 2021, it looks set to test the psychologically important 100 price level. Some resistance can be expected at this level. However, with geopolitical concerns weighing so heavily, this might be an instance where a key technical indicator is rolled over by the underlying fundamental factors in play.
EURUSD
For EURUSD, a continuing downwards movement appears likely. The price low of 1.1121 recorded on 28th January offered little support. Although the RSI is below 30, the price chart dating back to September 2021 highlights two previous occasions where this was the case, and the price failed to bounce with any conviction.
EURUSD – Daily chart – Wedge Pattern Breakout and Continued Price Fall
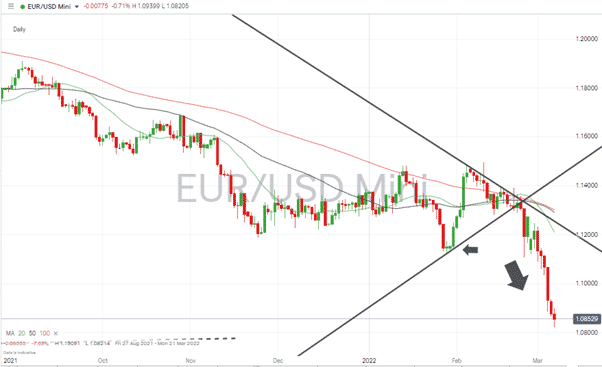
Source: IG
EURUSD – Daily chart – Oversold RSI <30 not being a reliable indicator of a significant price bounce
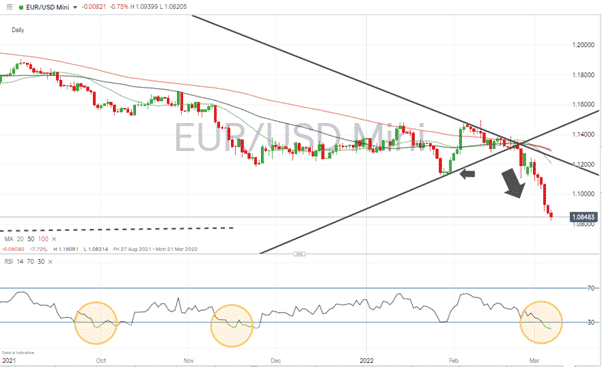
Source: IG
Short positions
- Entry Level 1: 1.10 Picking the right entry point for short positions would be based on selling into short-term strength. The psychologically important 1.10 price level can be expected to be a point at which renewed selling pressure comes into play.
- Target price: 1.063 – Price low of March 2020. The ‘dash to the dollar’ peak was seen during the Covid pandemic.
GBPUSD
GBPUSD – Daily chart – SMAs and trendline converging to form resistance
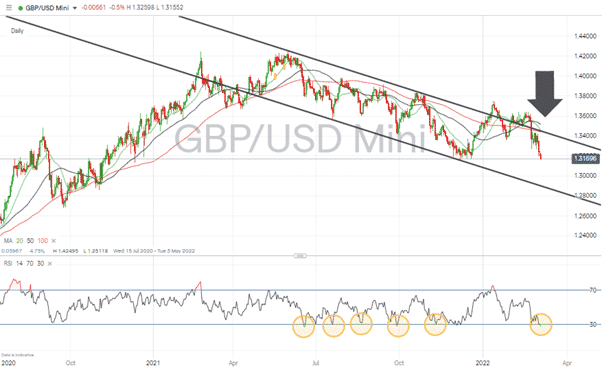
Source: IG
Long positions
- Entry Level 1: 1.316 – Support level marked by an area of price consolidation in December 2021. A bounce from here could form a double-bottom price pattern. Unlike EURUSD, the GBPUSD market has on several occasions seen price bounce when RSI touches the oversold level of 30.
- Price Target 1: 1.343 – 1.345 – Region of the upper downward trend line and point at which the 20, 50 and 100 SMA’s are converging.
- Stop Losses: < 1.316 – Low of 8th December 2021.
Short positions
- Entry Level 1: 1.343 – Selling into strength and using the resistance formed by the upper end of the price channel and convergence of the three key SMA’s.
- Price Target 1: 1.327 – Year to date price low, printed on 24th February.
- Stop Losses: > 1.3603 – High of 17th February.
Crypto – Bitcoin and Ethereum
Highlighting the unusual current market conditions, the crypto markets have shown relative stability compared to other asset groups.
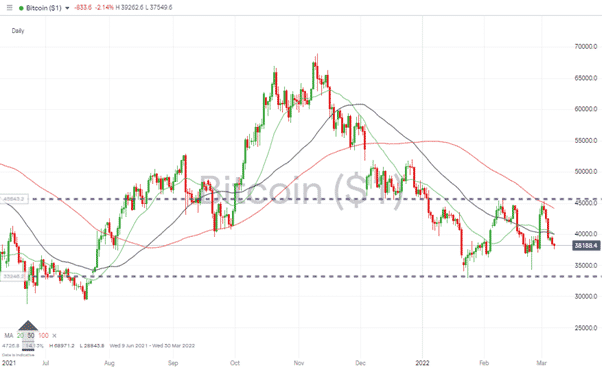
Bitcoin – Daily price chart – Test and Rebound off 36,269
Source: IG
Bitcoin Long positions
Bitcoin managed to test the psychologically important price level of $45,000 on Wednesday 2nd March but has since fallen away. The support seen in the region of $33,333 marks the bottom of a sideways trading range.
- Entry Level 1: 34,350 – Price low of 24th February.
- Price Target 1: 45,000 – ’round number’ resistance.
- Price Target 2: 45,822 – High of 10th February.
- Stop Losses 1: < 32,981
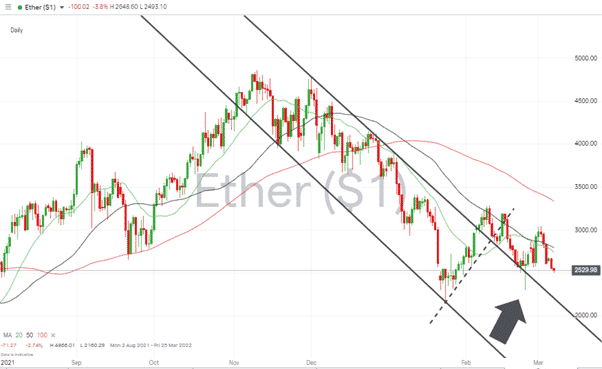
Ethereum – 1D price chart –Long-term Trend Line Breakout Still Holds
Source: IG
Ethereum Long positions
- Entry Level: 2,229 – Using the downward trend line as a guide to the trade entry point. ETH continues to follow but not close below that downward trend line. Whilst that situation holds, there is room for the consolidation price pattern to develop into a bullish one.
- Price Target 1: 3,188 – Price high of Wednesday 16th February.
- Stop Losses: < 2,160 Price low of 24th January. A relatively tight stop loss that might suit those looking to enter a speculative position in small size.
Risk Statement: Trading financial products carries a high risk to your capital, especially trading leverage products such as CFDs. They may not be suitable for everyone. Please make sure that you fully understand the risks. You should consider whether you can afford to take the risk of losing your money.

Forextraders' Broker of the Month
BlackBull Markets is a reliable and well-respected trading platform that provides its customers with high-quality access to a wide range of asset groups. The broker is headquartered in New Zealand which explains why it has flown under the radar for a few years but it is a great broker that is now building a global following. The BlackBull Markets site is intuitive and easy to use, making it an ideal choice for beginners.