
Instrument | Price | Hourly | Daily |
EUR/USD | 1.0931 | Buy | Strong Sell |
GBP/USD | 1.3038 | Neutral | Strong Sell |
USD/JPY | 117.72 | Strong Buy | Strong Buy |
S&P 500 | 4,228 | Strong Sell | Strong Sell |
NASDAQ 100 | 13,349 | Strong Sell | Strong Sell |
FTSE100 | 7,168 | Strong Buy | Strong Sell |
Gold | 1,972 | Strong Sell | Buy |
Crude Oil WTI | 103.31 | Strong Sell | Neutral |
Bitcoin | 39,022 | Strong Buy | Strong Sell |
Ethereum | 2,581 | Strong Buy | Strong Sell |
UTC 09:01
Our trading signal analysis is based on a comprehensive summary of market data. We use a range of metrics with weighting given to simple and exponential moving averages and key technical indicators.
We created this Weekly Tips section to share possible trade entry and exit points based on our technical analysis. We have other methods to validate our trades which we can’t publicly share that help to increase their success. All our trades include entry and at least one target price. Stop losses are applied at the reader’s discretion. Our strategies typically trade with a wide stop loss, and risk is further mitigated by trading in small sizes.
The FTSE 100 equity index, the euro-dollar currency pair, and crypto market indicators point towards short-term strength and long-term weakness. Trading decisions need to be made with holding periods in mind, and choppy market conditions could prevail in the run up to the Fed’s big announcement.
FOCUS ON: Short-term Strength vs Long-term Weakness
The ‘oversold’ indicators which dominated trading screens at the beginning of last week were picked up in this report and ultimately came good. It wasn’t easy picking the short-term bottom in the market, and long-term price patterns still point downwards. That leaves markets currently priced at levels that could easily go either way.
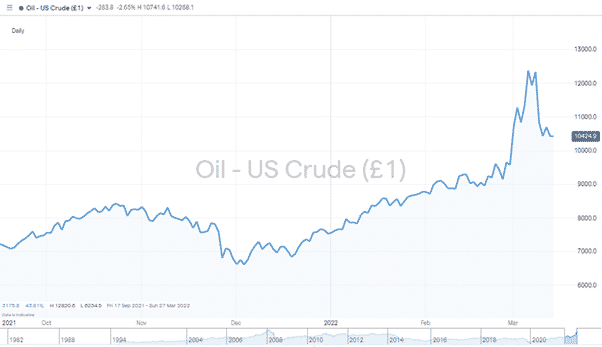
Crude Oil (WTI) – Daily Price Chart – Extreme volatility Continues
Source: IG
The oil price continues to have an abnormal influence on other asset groups. The 15% week-on-week drop in the price of WTI crude goes some way to explaining why equities rebounded into the close of last week.
While the slide in oil prices tempted some investors to buy back into riskier assets, crude remains above the psychologically important $100 price bar. The reluctance of OPEC to meet US demands for greater production levels suggests it could stay there for some time. Possibly more concerning is the volatility in the crude market. Since the beginning of March, US WTI has increased in price by 33.9% and has then fallen by 21.07%.
Geopolitical tensions continue to dominate the market sentiment, but attention will also turn to the US Federal Reserve (FOMC) that meets this week. On Wednesday, Jerome Powell and his team are expected to announce the first interest rate hike since the Covid pandemic hit. Before the Ukraine crisis, some thought was given to the idea that a 0.5% rather than a 0.25% rate increase could be on the cards. A more modest rate increase is now being priced. Any announcement which doesn’t match the 0.25% forecast can be expected to cause a sudden shift in price levels across all markets.
Indices
NASDAQ 100
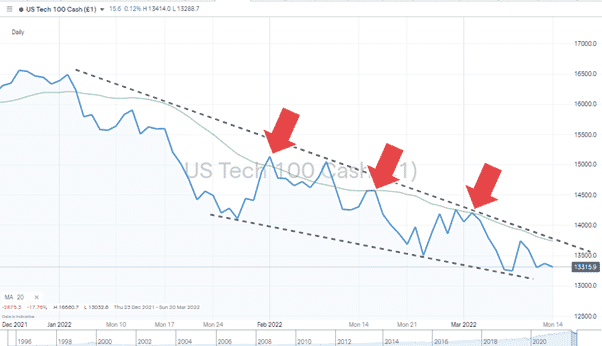
Price action on the Nasdaq 100 daily charts continues to plot a bearish course. The index has started the week trading in the middle of its downward wedge pattern, leaving room for short-term price rises. The 20 Day SMA has proved a resilient resistance level over the last two months. It currently sits in the same region as the upper trend line, which suggests any positions trading short-term bullishness might need to be scaled back if they reach the 13,741 level.
Nasdaq 100 Chart – 1Day Candles – 20 Day SMA providing resistance during price rallies
Source: IG
Long positions
- Entry Level 1: 13,106 – Year to date low printed on Tuesday 8th March.
- Price Target 1: 13,741 – Region of 20 SMA on Daily chart and upper trend line of the falling wedge pattern.
- Price Target 2: 14,284 – In extension, region of 50 SMA on Daily price chart.
- Stop Loss: < 13,000– Psychologically important “round number” price level which sits just below the supporting trend line of the wedge pattern. A relatively tight stop loss would minimise losses if the downward price move continued.
Short positions
- Entry Level 1: 13,741 – Region of 20 SMA on Daily chart and upper trend line of the falling wedge pattern.
- Price Target 1: 13,106 – Year to date low printed on Tuesday 8th March
- Stop Loss: > 13,800 – Using the upper trend line as supporting trend line of the wedge pattern. A relatively tight stop loss would minimise losses if the upward price move continued.
FTSE 100
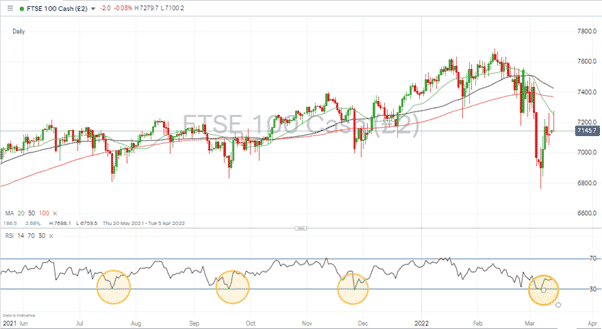
The FTSE’s massive sell off during the beginning of March triggered several ‘oversold’ indicators, and those who bought into the Daily RSI touching 30 will have banked profits once more.
FTSE 100 Daily Price Chart – Bounces off Daily RSI being oversold … again.
Source: IG
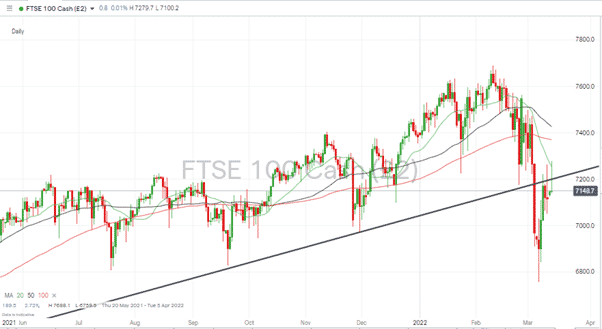
Price has recovered as far as the long-term trend line, which once offered support but now represents resistance. The kiss of the Daily 20 SMA at 7,254 suggests that metric could also put a cap on further upward movement.
FTSE 100 Daily Price Chart – Trend line and 20 SMA providing resistance
Source: IG
Long positions
- Entry Level 1: 7,206 – With price sitting below two important resistance levels, bulls might want to wait for a breakout pattern to form before committing too much capital. A change in the geopolitical climate, such as a cooling of tensions in Ukraine, could act as a catalyst for such a move.
- Price Target 1: 7,255 – Region of 20 SMA on Daily price chart.
- Price Target 1: 7,333 – The 61.8% Fibonacci retracement level of the selloff started on 10th February
- Stop Loss: < 7,150 – Using the multi-month trend line as a guide.
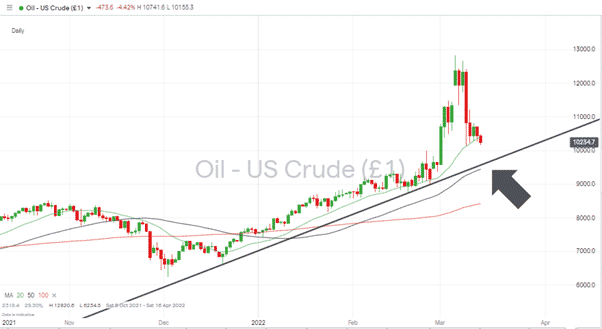
Oil
The extreme volatility in the oil market has been followed by a period of price consolidation in the region of the 20 SMA on the Daily price chart. With the upward trend continuing, it could be a case of picking the best place to buy the dip.
Oil – Daily price chart – SMAs and supporting trendline coming into play
Long positions
- Entry Level 1: 104.12 – A close above the 20 SMA on the Daily price chart would be a bullish signal. After testing that level for several days, oil started trading the week below the 20 SMA so that a quick rebound would point to the path of least resistance being upwards.
- Entry Level 2: 95.63 – Further price weakness could offer a buying opportunity in the region of the supporting trendline and Daily 50 SMA (94.41).
- Price Target 1: 128.20 – Price high printed on 6th March.
- Stop Loss: < 94.41 – Region of 50 SMA on Daily price chart.
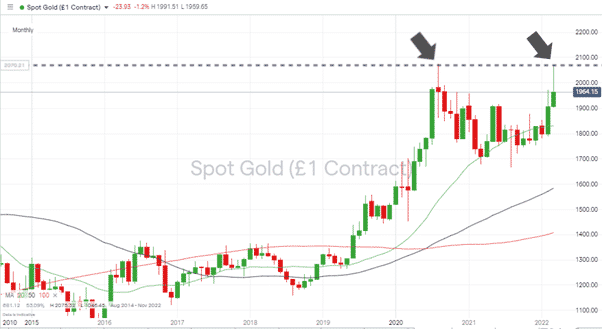
Gold
It’s stick or twist time for gold-bugs with the metal potentially forming a classic double-top price pattern.
Gold – Monthly chart – Double-Top price pattern forming
Long positions
- Entry Level 1: 1,829 – Those going long could wait for a pull-back to the 20 SMA on the Monthly price chart that currently sits at 1,829.
- Price Target 1: 2,070 – Price highs printed in August 2020 and March 2022.
- Stop Loss: < 1,667 – Price low of August 2021 and lowest price for the metal since June 2020.
Forex
The eurozone’s proximity to Ukraine is resulting in volatility levels in EURUSD outstripping those in other currency pairs. Indicators point to EURUSD being a ‘Buy’ on an hourly basis but still a ‘Strong Sell’ on a daily basis.
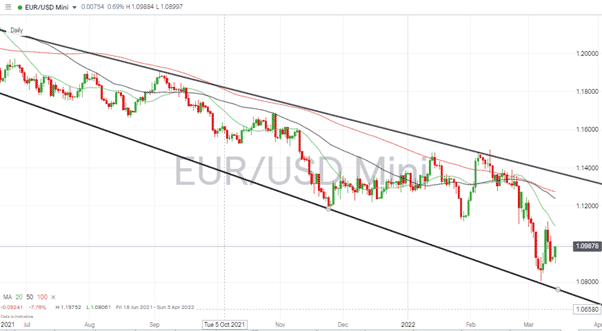
EURUSD
The downwards trading channel of EURUSD is widening due to volatility picking up. There’s currently plenty of room for price to move before hitting the support or resistance trend lines which sit at 1.077 and 1.137, respectively.
EURUSD – Daily chart – Price channel widening as volatility picks up
Source: IG
Long positions
- Entry Level 1: 1.077 – Region of supporting trend line.
- Target price 1: 1.109 – Region of 20 SMA on Daily price chart.
- Target price 2: 1.137 – In extension – region of resistance trend line.
- Stop Loss: < 1.070 – Below supporting trend line.
Short positions
- Entry Level 1: 1.077 – With price hovering above a key support level, those looking to trade short are left with the option of waiting for price to show strength or trading a breakout strategy if it breaks below 1.077.
- Target price 1: 1.063 – Price low of March 2020.
- Stop-loss 1: 1.109 – Region of 20 SMA on Daily price chart.
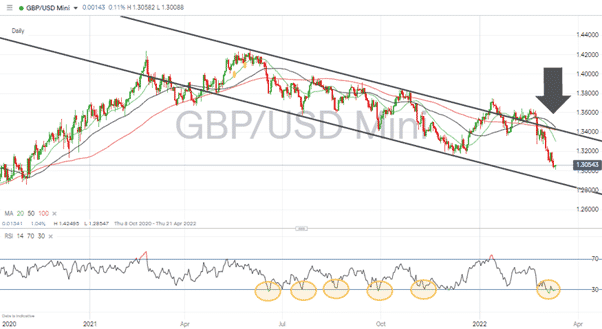
GBPUSD
GBPUSD – Daily chart
Source: IG
Long positions
- Entry Level 1: 1.300 – Long-term price action can only be described as bearish. However, with the supporting trendline coming into range, the psychologically important price level of 1.30 could be expected to be associated with buyers of sterling stepping into the market.
- Price Target 1: 1.333 – Region of the 20 SMA on the Daily price chart.
- Price Target 2: 1.342 – Region of the upper downward trend line and point at which the Daily 50 and 100 SMA’s are converging.
- Stop Losses: < 1.285 – Current region of the supporting trendline.
Short positions
- Entry Level 1: 1.343 – The break of the 1.316 low printed on 8th December opened the door to further downward price movement. The RSI remains below 30, but some will be putting on short positions here in expectation of a test of the psychologically important 1.30 price level.
- Price Target 1: 1.300 – ‘Round number’ price support level.
- Stop Losses: 1.365 – Price high of 18th February.
Crypto – Bitcoin & Ethereum
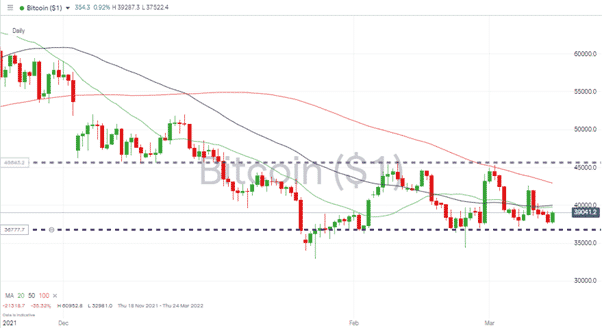
Major cryptos continue to form consolidation patterns. Both Bitcoin and Ethereum are at the lower end of their sideways trading ranges offering buyers an opportunity to work into positions with relatively tight stop losses.
Bitcoin – Daily price chart – Sideways trading pattern
Source: IG
Bitcoin Long positions
Bitcoin managed to test the psychologically important price level of $45,000 on Wednesday 2nd March but has since then fallen away. The support seen in the region of $33,333 marks the bottom of a sideways trading range.
- Entry Level 1: 37,023 – Closing price low of 21st February.
- Price Target 1: 45,000 – ‘round number’ resistance.
- Price Target 2: 45,822 – High of 10th February.
- Stop Losses 1: < 34,350 -Intraday low of 24th February.
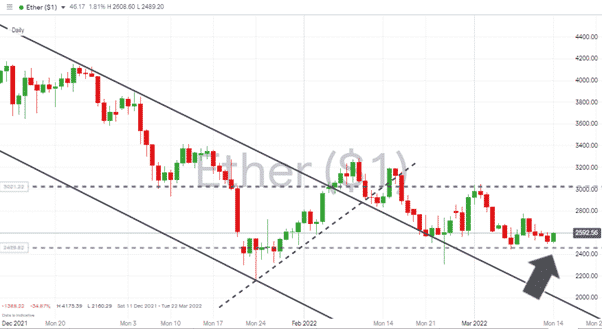
Ethereum – Daily price chart – After breakout – now forming a sideways trading pattern
Source: IG
Ethereum Long positions
- Entry Level: 2,445 – Price low of 7th March, representing the bottom of the sideways trading channel.
- Price Target 1: 3,188 – Price high of Wednesday 16th February.
- Stop Losses: < 2,160 Price low of 24th January and level just below the sideways price channel. A relatively tight stop loss that might suit those looking to enter a speculative position in small size.
Risk Statement: Trading financial products carries a high risk to your capital, especially trading leverage products such as CFDs. They may not be suitable for everyone. Please make sure that you fully understand the risks. You should consider whether you can afford to take the risk of losing your money.

Forextraders' Broker of the Month
BlackBull Markets is a reliable and well-respected trading platform that provides its customers with high-quality access to a wide range of asset groups. The broker is headquartered in New Zealand which explains why it has flown under the radar for a few years but it is a great broker that is now building a global following. The BlackBull Markets site is intuitive and easy to use, making it an ideal choice for beginners.