
Instrument | Price | Hourly | Daily |
EUR/USD | 1.0956 | Strong Sell | Strong Sell |
GBP/USD | 1.3152 | Strong Sell | Strong Sell |
USD/JPY | 123.70 | Strong Buy | Strong Buy |
S&P 500 | 4,536 | Strong Buy | Strong Buy |
NASDAQ 100 | 14,726 | Strong Buy | Strong Buy |
FTSE100 | 7,515 | Strong Buy | Strong Buy |
Gold | 1,934 | Strong Sell | Neutral |
Crude Oil WTI | 108.68 | Strong Sell | Strong Buy |
Bitcoin | 46,913 | Strong Buy | Strong Buy |
Ethereum | 3,313 | Strong Buy | Strong Buy |
UTC 09:45
Our trading signal analysis is based on a comprehensive summary of market data. We use a range of metrics with weighting given to simple and exponential moving averages and key technical indicators.
We created this Weekly Tips section to share possible trade entry and exit points based on our technical analysis. We also have other methods to validate our trades that we can’t publicly share that help to increase their success. All our trades include entry and at least one target price. Stop losses are applied at the reader’s discretion. Our strategies typically trade with a wide stop loss, and risk is further mitigated by trading in small sizes.
The FTSE 100 equity index, the euro-dollar currency pair, and crypto market indicators point towards short-term strength and long-term weakness. Trading decisions need to be made withholding periods in mind, and choppy market conditions could prevail in the run-up to the Fed’s big announcement.
FOCUS ON: US Jobs Numbers On Friday Set To Mark The Start Of The Next Trend
The US jobs numbers due to be released on Friday are due to hit the markets at a time when price levels are critically poised. All options are open for forex markets which formed a holding pattern during the run into last week, and the equity markets look set to have their recent upwards momentum tested.
Friday’s Non-Farm Payroll job numbers could set the scene for April being a month in which to jump back into risk-on assets and confirm an upward breakout for a range of different markets. Suppose the interpretation of the numbers is negative. In that case, the bearish pattern which has dominated since the beginning of the year could once more become the driving force of the financial system.
S&P 500 – Daily Price Chart – Breakout above 4590?
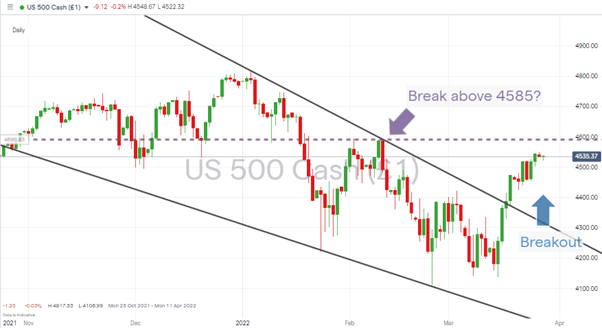
Source: IG
The sideways trading patterns in GBPUSD and EURUSD suggest the jury is still out on the fate of the US dollar. Increased volatility in those markets can be expected as the global geopolitical mainframe is realigned due to the Ukraine-Russia conflict.
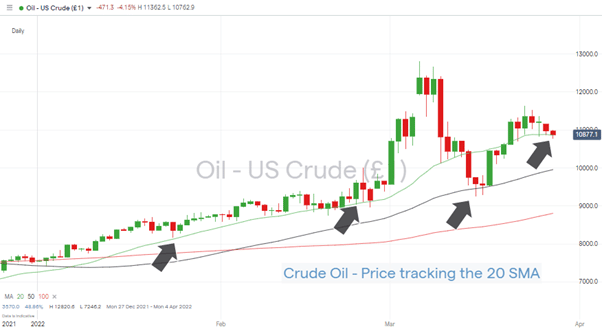
Crude Oil (WTI) – Daily Price Chart – Upwards Movement Continues
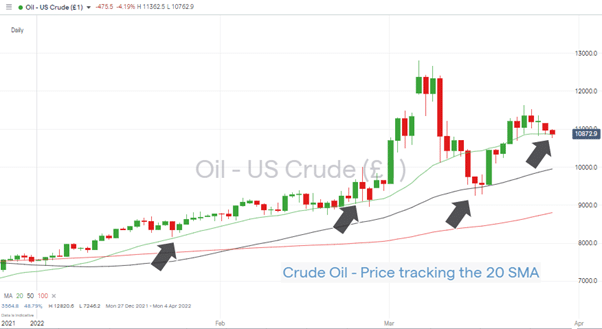
Source: IG
Oil is another market that feels like being in a situation best described as ‘the quiet before the storm’. The 20 SMA on the Daily Price Chart continues to be the go-to indicator for crude, but with the OPEC meeting on Thursday, another more dramatic move could be in the pipeline.
Indices
NASDAQ 100
The break of the multi-month downward trend line, which dates back to the start of the year, has so far held. A return to kiss the line still can’t be ruled out, but a brief pullback that tests the trend line and bounces above it could still be seen as a part of a bullish pattern.
The Daily RSI (59.3) is still some way off being ‘overbought’, so there is potential for further upwards movement. Still, the 50% Fibonacci retracement level and 100 SMA on a daily timeframe are resistance levels that are now in play.
Nasdaq 100 Chart – 1Day Candles – New Resistance Levels Approaching
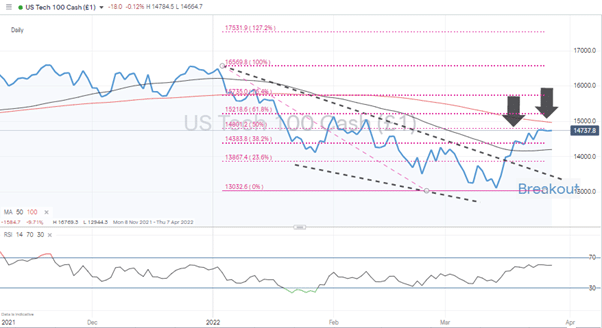
Source: IG
Long positions
- Entry Level 1: 14,801 – 50% Fib retracement level of the price crash seen in Q1 of 2022. Also, a big ‘round number’ price level. If the US jobs numbers are well received, a break of this level could become significant support, so stop losses could be set just below 14,800.
- Price Target 1: 14,965 – Region of 100 SMA on the Daily Price Chart and just below the 15,000 ‘big number’ price resistance.
- Price Target 2: 15,276 – Price high of 2nd February.
- Stop Loss: < 14,800.
Short positions
- Entry Level 1: 14,801 – Using the 50% Fib retracement level of the price crash seen in Q1 as a platform from which to sell short. Again, a lot comes down to how the US Non-Farm Payroll numbers are received on Friday.
- Price Target 1: 14,201 – Region of 50 SMA on Daily price chart
- Price Target 2: 13,480 – Region of the upper trend line of the price channel formed between January and March of 2022.
- Stop Loss: > 14,800.
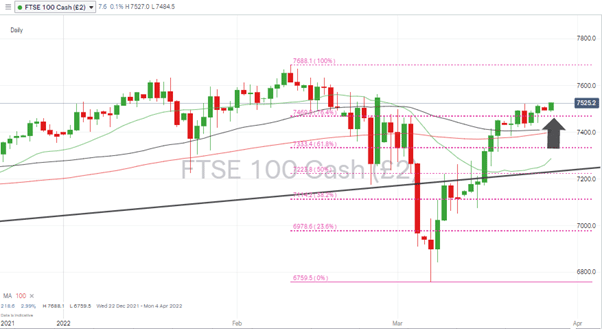
FTSE 100
Continued strength in the FTSE 100 was forecast last week, and the path of least resistance still appears to be upward.
FTSE 100 Daily Price Chart – Little Resistance to Further Upward Movement
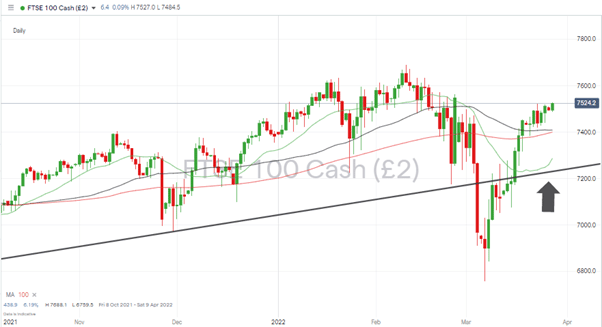
Source: IG
Resistance in the form of the 76.4% Fib retracement was successfully navigated by the bulls, which leaves few other metrics between current price levels and the year-to-date price high of 7,688 recorded on 10th February.
FTSE 100 Daily Price Chart – Fib resistance level coming into play
Source: IG
Long positions
- Entry Level 1: 7,469 – Dip-buying in the 76.4% retracement level region could offer a way of catching further upward price moves.
- Price Target 1: 7,688 – Year-to-date high recorded in February. There is minimal resistance between current price levels and a test of 7,688.
- Stop Loss: < 7,408 – Region of the 50 SMA and a big-number price support level.
Oil
Oil daily price volatility levels are still high, but crude prices were up a relatively modest 1.9% between Monday 21st and Monday 28th March on a week-on-week basis.
The sideways movement in price and tracking of the 20 SMA on the Daily Price Chart could end this week. OPEC’s meeting on Thursday to discuss future production levels is a traditional trigger for the price to move in one direction or the other.
US Crude Oil – Daily price chart – Still Tracking the 20 SMA
Source: IG
Long positions
- Entry Level 1: 108.61 – Using the 20 SMA on the Daily price chart as the entry point for long positions.
- Price Target 1: 128.20 – Price high printed on 6th March. Geopolitical risk in Ukraine-Russia remains a potential catalyst for upwards price moves.
- Stop Loss: < 99.58 – Region of the 50 SMA on the Daily price chart. It also sits just below the ‘big number’ price support level of $100.
Forex
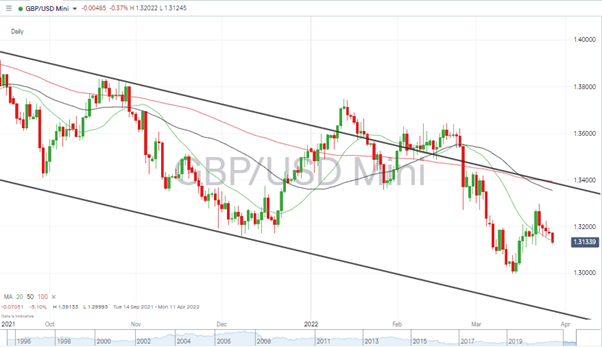
GBPUSD
Cable’s – 0.02% week-on-week price move was tiny, but this hides a sudden spike in price on 22nd March, followed by a gradual slide and return to the 131.30 price level. Last week’s report identified the potential for short-term price strength, but traders would have had to be quick to lock in profits. As things stand, the price continues to track the 20 SMA on the Daily Price Chart, which points to the potential for further downwards movement.
GBPUSD – Daily chart
Source: IG
Short positions
- Entry Level 1: 1.314 – A break of the 20 SMA would open the door to another test of the supporting trend line of the price channel, which dates back to April 2021.
- Price Target 1: 1.2835 – Region of the supporting trendline.
- Stop Losses: > 1.335 – 1.339 – Current region of the 50 and 100 SMA and upper range of downwards channel.
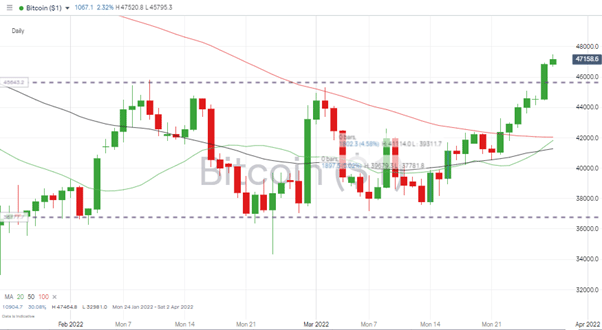
Crypto – Bitcoin and Ethereum
A positive week for cryptos has renewed interest in the market. Ethereum has now surged in value by 33% in the space of two weeks, and Bitcoin has increased by 24% over the same timeframe.
Bitcoin – Daily price chart – Finally out of a sideways trading pattern
Source: IG
Bitcoin Long positions
The price rise in Bitcoin is impressive in its own right, but the breakout of the long-term sideways trading channel is a notable development.
- Entry Level 1: 45,822 – Price high of 10th February – looking to buy into the upwards trend if there is a pullback to this region which has transformed from offering resistance to offering support.
- Price Target 1: 50,000 – ‘round number’ resistance.
- Price Target 2: 51,800 – Intraday low of 3rd December – using a gap-fill strategy.
- Stop Losses 1: < 45,800 – Just below the upper end of the sideways channel.
Ethereum – Daily price chart – Ready to test upper trendline resistance
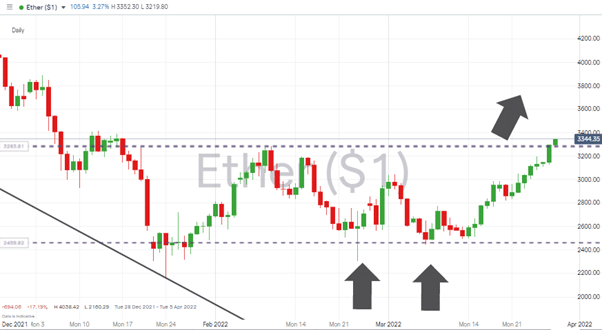
Source: IG
Ethereum Long positions
Ether has also broken out of its sideways channel, and the two dips in the last week of February and the first week of March are showing signs of being a double-bottom price pattern.
- Entry Level: 3,284 – Price high of 10th February and the upper end of the sideways trading channel.
- Price Target 1: 4,000 – Psychologically important ‘round number’ level, which acted as support in December and now has the potential to act as resistance.
- Stop Losses: < 3,000 – Using the ‘big number’ price level as a guide and placing stops below the top of the upper trendline.
Risk Statement: Trading financial products carries a high risk to your capital, especially trading leverage products such as CFDs. They may not be suitable for everyone. Please make sure that you fully understand the risks. You should consider whether you can afford to take the risk of losing your money.

Forextraders' Broker of the Month
BlackBull Markets is a reliable and well-respected trading platform that provides its customers with high-quality access to a wide range of asset groups. The broker is headquartered in New Zealand which explains why it has flown under the radar for a few years but it is a great broker that is now building a global following. The BlackBull Markets site is intuitive and easy to use, making it an ideal choice for beginners.