
Instrument | Price | Hourly | Daily |
EUR/USD | 1.1040 | Strong Sell | Sell |
GBP/USD | 1.3155 | Neutral | Strong Sell |
USD/JPY | 119.23 | Strong Buy | Strong Buy |
S&P 500 | 4,447 | Strong Buy | Strong Buy |
NASDAQ 100 | 14,338 | Strong Buy | Strong Buy |
FTSE100 | 7,402 | Strong Buy | Strong Buy |
Gold | 1,923 | Strong Sell | Neutral |
Crude Oil WTI | 106.60 | Strong Buy | Neutral |
Bitcoin | 40,891 | Strong Buy | Buy |
Ethereum | 2,866 | Strong Buy | Buy |
UTC 08:14
Our trading signal analysis is based on a comprehensive summary of market data. We use a range of metrics with weighting given to simple and exponential moving averages and key technical indicators.
We created this Weekly Tips section to share possible trade entry and exit points based on our technical analysis. We also have other methods to validate our trades which we can’t publicly share that help to increase their success. All our trades include entry and at least one target price. Stop losses are applied at the reader’s discretion. Our strategies typically trade with a wide stop loss, and risk is further mitigated by trading in small sizes.
The FTSE 100 equity index, the euro-dollar currency pair, and crypto market indicators point towards short-term strength and long-term weakness. Trading decisions need to be made with holding periods in mind, and choppy market conditions could prevail in the run up to the Fed’s big announcement.
FOCUS ON: Short-term Strength vs Long-term Weakness
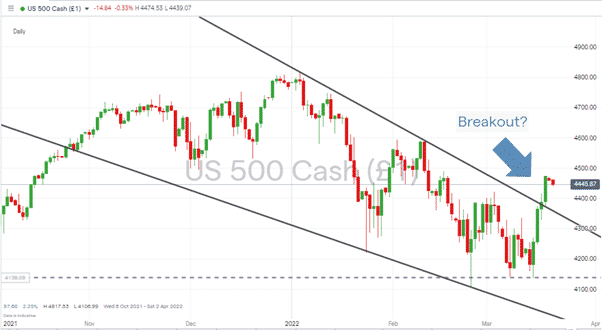
An impressive price surge by risk-on assets has sent momentum indicators into ‘Strong Buy’ mode. Last week’s US interest rate hike was successfully navigated by equity market bulls who, in four trading sessions, took stocks from the bottom end of their oversold trading range, through upper resistance price levels and into ‘breakout strategy’ territory.
Forex markets followed the move, with EURUSD and GBPUSD continuing to rise in value. Those currency pairs are yet to test the upper ends of their multi-month trading ranges, so there’s still some question whether these are short-term rallies or the start of something bigger.
S&P 500 – Daily Price Chart – Breakout?
Source: IG
A big disconnect between oil prices and equity and forex prices suggests volatility levels could remain high. Week-on-week gains in the S&P 500, Nasdaq 100 and FTSE 100 were 5.18%, 7.41% and 3.26%, respectively, but oil was also 3.18% up on the week.
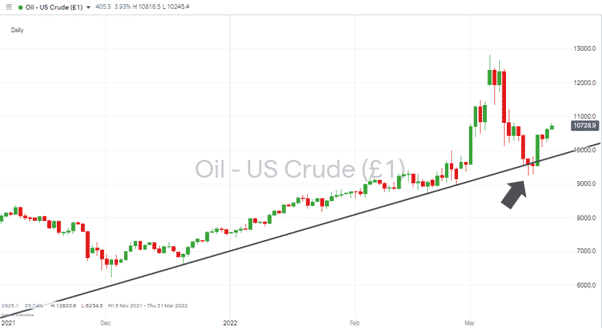
Crude Oil (WTI) – Daily Price Chart – Upwards Movement Continues
Source: IG
Oil prices might not have quite the same impact on the global economy as they did in the 1970s, but US crude trading at over $100 per barrel can be expected to be a drag on global economic performance. High petrol pump prices eat into disposable income and feed into the financial system in the form of rising prices. The possibility that equity prices might bounce off long-term resistance levels was flagged up in this report, with the question being, can they sustain the momentum with oil prices continuing to forge upwards.
Indices
NASDAQ 100
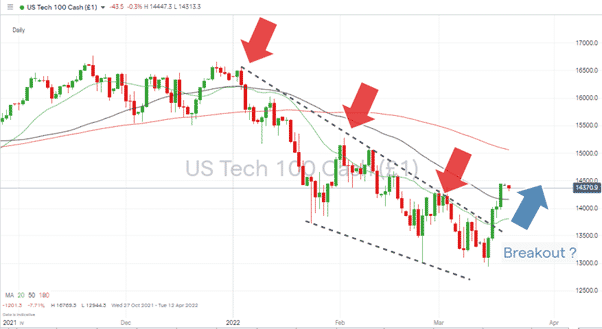
After recording four consecutive ultra-strong trading sessions, the Nasdaq is still 13.32% lower in value than it was at the start of the year. That headroom for further price rises opens the door to those banking on further gains and looking to buy the dips.
Nasdaq 100 Chart – 1Day Candles – Breakout Pattern
Source: IG
Long positions
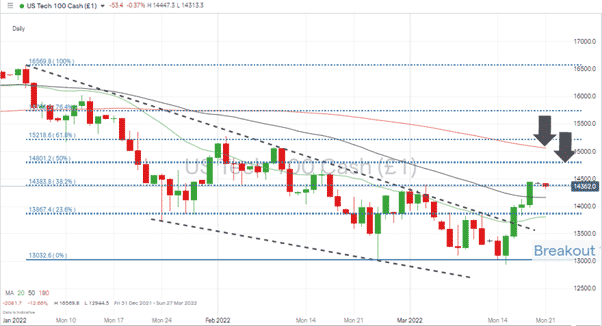
- Entry Level 1: 14,161 – Region of the 50 SMA on the Daily price chart. Using that metric as a potential entry point into continued solid upward momentum.
- Price Target 1: 14,801 – 50% Fibonacci retracement level of the price fall between 4th January and 24th February.
- Price Target 2: 15,060 – In extension, region of 100 SMA on Daily chart and upper trend line of the falling wedge pattern.
- Stop Loss: < 13,809 – Region of the 20 SMA on the daily price chart – which was identified in this report as being a key metric in recent weeks. Also, just below the psychologically significant “round number” price level of 14,000.
Nasdaq 100 Chart – 1Day Candles – Using 50% Fib Retracement and Daily SMAs as guides
Source: IG
FTSE 100
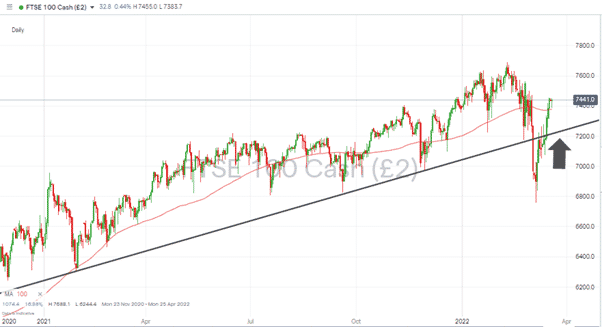
Long-term metrics point to a potential continuation of the recent strength in the FTSE 100. The index is trading back above its supporting trendline, which dates back to January 2021, and the 100 SMA on the Daily price chart.
FTSE 100 Daily Price Chart – Back above long-term supporting trendline
Source: IG
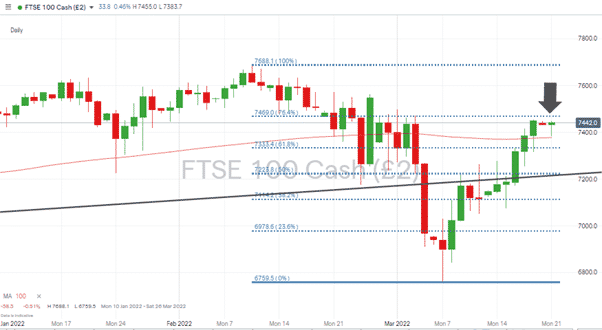
Resistance comes in the form of the 76.4% Fib retracement at 7,469, but if price can break through that level, there are few other metrics between there and the year-to-date price high of 7,688 recorded on 10th February.
FTSE 100 Daily Price Chart – Fib resistance level coming into play
Source: IG
Long positions
- Entry Level 1: 7,378 – Region of the 100 SMA on the Daily price chart. Using that metric as a potential entry point for dip-buying. The trading range of Monday 21st February included a kiss of that price level which was subsequently marked by a strong bounce in price.
- Price Target 1: 7,688 – Year-to-date high recorded in February. Few other metrics provide resistance, but after a series of bullish trading sessions, it could be a long-haul getting back to that level. A period of price consolidation near the 76.4% Fib can’t be discounted.
- Stop Loss: < 7,222 – Region of the supporting trend line and 50% Fib retracement level. The presence of two key metrics in the same price region using the multi-month trend line as a guide.
Oil
Oil’s influence on the rest of the market means the price charts of crude are being closely monitored by those who aren’t even actively trading. During the middle of last week, the price fall saw oil close Wednesday’s session at $95.46, which was below the trendline dating back to December 2021, but bulls were easily able to regain momentum in the run-up to the weekend.
Thursday’s price rise of 9.36% in one trading session points to an upward path of least resistance. Those who used the second entry point of $95.63, mentioned in last week’s report on the market, will now be in a comfortable long position.
US Crude Oil – Daily price chart – Back above the supporting trendline
Source: IG
Long positions
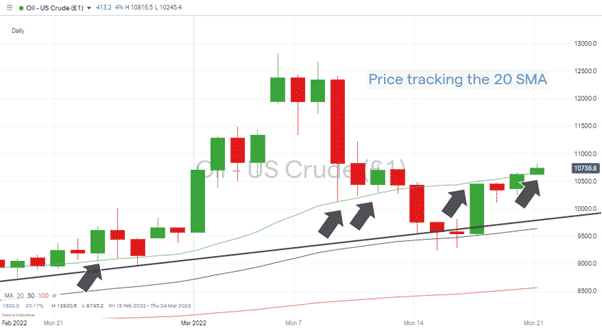
- Entry Level 1: 106.73 – Using the 20 SMA on the Daily price chart as an entry point for long positions would be a bullish signal. After testing that level for several days, oil started trading the week below the 20 SMA so that a quick rebound would point to the path of least resistance being upward.
US Crude Oil – Daily price chart – Price tracking the 20 SMA
Source: IG
- Price Target 1: 128.20 – Price high printed on 6th March. If fundamental analysis data points to a worsening of the geopolitical crisis, a spike to the price levels of 6th March would appear easily achievable.
- Stop Loss: < 96.42 – Region of the 50 SMA on the Daily price chart. It also sits just below the supporting trendline currently printing in the region of $97.80.
Gold
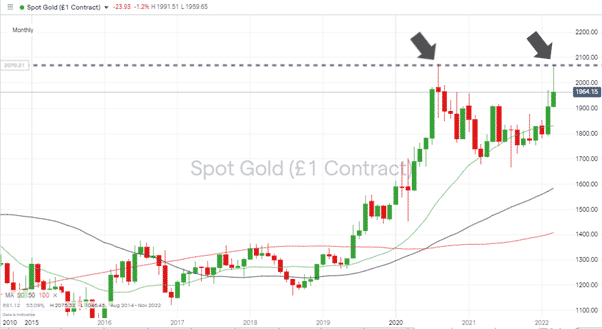
Last week, the move into risk-on assets wasn’t matched by selling pressure in gold. This disconnect between asset groups suggests equity bulls might want to proceed with caution. The metal’s double-top price pattern still limits upward price movement, but whilst price is consolidating above the $1,900 level, a retest of the $2,100 price range can’t be discounted.
Gold – Monthly chart – Double-Top price pattern forming
Long positions
- Entry Level 1: 1,900 – Those going long could wait for a pull-back to the psychologically important ‘round number’ price level.
- Price Target 1: 2,070 – Price highs printed in August 2020 and March 2022.
- Stop Loss: < 1,889 – Using the 50 SMA on the Daily price chart.
Forex
The eurozone’s close proximity to Ukraine is resulting in volatility levels in EURUSD outstripping those in other currency pairs. Indicators point to EURUSD being a ‘Buy’ on an hourly basis but still a ‘Strong Sell’ daily.
GBPUSD
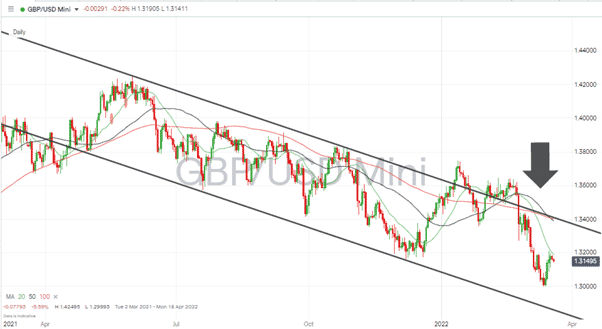
Long-term price action continues to point downward, but last week’s rally in cable has offered bulls some hope. The 20 SMA on the Daily price chart could be the key metric to watch over the upcoming trading sessions.
GBPUSD – Daily chart
Source: IG
Long positions
- Entry Level 1: 1.300 – This level was identified in last week’s report, and the role played by the psychologically important price level proved once more to be significant.
- Entry Level 2: 1.3188 – An alternative approach is to use a breakout strategy and buy into any breakthrough of the 20 SMA on a Daily timeframe.
- Price Target 1: 1.338 – 1.3440 – Region of the 50 and 100 SMAs on the Daily price chart and top end of the downwards trading channel.
- Stop Losses: < 1.284 – Current region of the supporting trendline.
Crypto – Bitcoin & Ethereum
Some good news for crypto bulls after Bitcoin posted two daily gains above 4% during last week’s trading. Ether’s gain between Monday and Friday totalled 17.36%. With both cryptos failing to race away there are likely to be opportunities to buy into moments of weakness.
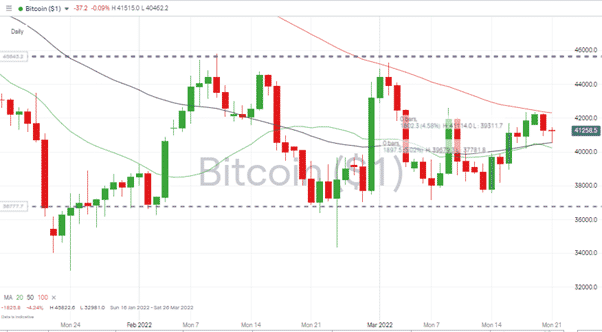
Bitcoin – Daily price chart – Sideways trading pattern
Source: IG
Bitcoin Long positions
The bounce in price recorded last week could be little more than a continuation of sideways movement in the trading range formed at the beginning of the year. Even if that is the case, there is still headroom before price hits the top of the range at $45,822.
- Entry Level 1: 40,555 – Region of the 50 SMA on Daily price chart.
- Price Target 1: 45,000 – ‘round number’ resistance.
- Price Target 2: 45,822 – High of 10th February.
- Stop Losses 1: < 34,350 -Intraday low of 24th February.
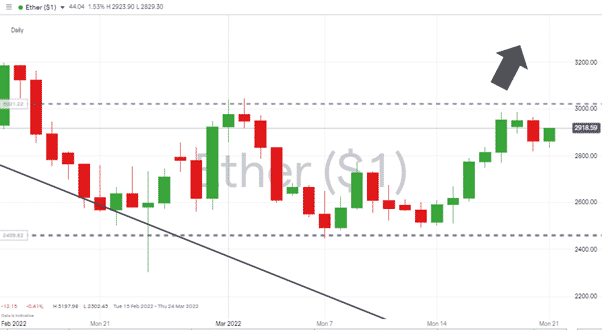
Ethereum – Daily price chart – Ready to test upper trendline resistance
Source: IG
Ethereum Long positions
Ether’s rally has taken it closer than Bitcoin to the top end of the coin’s trading ranges. It could be time to hold fire on further long positions, which would be undone if sideways patterns hold. A breakout above the resistance level of 3,044 would signal the start of a new trend.
- Entry Level: 3,044 – Price low of 2nd March, representing the top of the sideways trading channel.
- Price Target 1: 3,188 – Price high of Wednesday 16th February.
- Stop Losses: < 3,000 – Using the ‘big number’ price level as a guide and placing stops below the top of the upper trendline.
Risk Statement: Trading financial products carries a high risk to your capital, especially trading leverage products such as CFDs. They may not be suitable for everyone. Please make sure that you fully understand the risks. You should consider whether you can afford to take the risk of losing your money.

Forextraders' Broker of the Month
BlackBull Markets is a reliable and well-respected trading platform that provides its customers with high-quality access to a wide range of asset groups. The broker is headquartered in New Zealand which explains why it has flown under the radar for a few years but it is a great broker that is now building a global following. The BlackBull Markets site is intuitive and easy to use, making it an ideal choice for beginners.