
Instrument | Price | Hourly | Daily |
EUR/USD | 1.0791 | Buy | Strong Sell |
GBP/USD | 1.3009 | Neutral | Strong Sell |
USD/JPY | 127.99 | Strong Buy | Strong Buy |
S&P 500 | 4,396 | Strong Sell | Strong Sell |
NASDAQ 100 | 13,920 | Sell | Strong Sell |
FTSE100 | 7,604 | Strong Buy | Strong Buy |
Gold | 1,979 | Buy | Strong Buy |
Crude Oil WTI | 106.75 | Sell | Strong Buy |
Bitcoin | 40,676 | Strong Sell | Strong Buy |
Ethereum | 3,037 | Strong Sell | Strong Buy |
UTC 09:12
Our trading signal analysis is based on a comprehensive summary of market data. We use a range of metrics with weighting given to simple and exponential moving averages and key technical indicators.
We created this Weekly Tips section to share possible trade entry and exit points based on our technical analysis. We also have other methods to validate our trades that we can’t publicly share that help to increase their success. All our trades include entry and at least one target price. Stop losses are applied at the reader’s discretion. Our strategies typically trade with a wide stop loss, and risk is further mitigated by trading in small size.
The FTSE 100 equity index, the euro-dollar currency pair, and crypto market indicators are all pointing towards short-term strength and long-term weakness. Trading decisions need to be made with holding periods in mind, and choppy market conditions could prevail in the run-up to the Fed’s big announcement.
FOCUS ON: Earnings Season, Elon and Twitter
This week might be shortened due to national holidays, but it looks set to provide more than enough newsworthy events. The US earnings season should be the primary driver of stock prices with big blue-chip names such as Johnson & Johnson and Netflix due to update investors on Q1 trading. The curveball is the situation regarding Elon Musk’s proposed takeover of Twitter. The poison pill strategy adopted by the social media platform’s board appears likely to create more rather than less interest in the developing story.
Forex markets are being driven by fundamentals, and some currency pairs show signs of diversion. Over the last week, the dollar has rallied hard against the Japanese yen and softened slightly against the British pound, but EURUSD could be the market to watch this week.
The French presidential election takes place next weekend and is turning into a closely run affair. A change at the top with the election of Marine Le Pen doesn’t necessarily mean “Frexit” is on the cards but would be enough of a warning shot to unsettle leaders of the EU.
In the commodity markets, oil’s bounce back to above $100 per barrel suggests the path of least resistance for crude still appears to be upwards. With political uncertainty still hanging over the markets, the strength in gold means it could be preparing to test the resistance levels formed by the multi-year double-top pattern.
Indices
NASDAQ 100
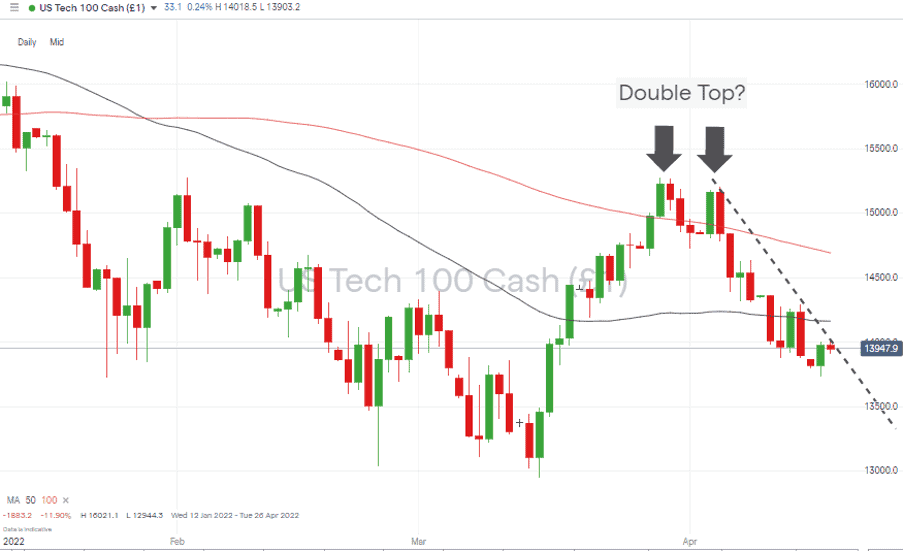
The Nasdaq’s continued weakness means it is still trading in line with the double-top price pattern developed during March. With price still trading below the 50 and 100 SMA’s on the Daily Price Chart, there is potential for further downward movement.
A break of the downwards trendline would offer hope to the bulls, and with Netflix and IBM releasing Q1 earnings reports on Tuesday, there are potential catalysts in play for those looking to go long.
Nasdaq 100 Chart – 1Day Candles – Double-top pattern and trendline holding
Source: IG
Long positions
- Entry Level 1: 13,959 – Using a breakout trading strategy. Current region of the downward trendline.
- Price Target 1: 14,162 – Region of 50 SMA on Daily Price Chart
- Price Target 2: 15,275 – In extension, price high of 29th March 2022. Price needs to trade above this level to confirm a bullish rather than a bearish pattern so that it will be an area of significant resistance.
- Stop Loss: < 13,730 – Intraday price low of 18th April 2022.
Short positions
- Entry Level 1: 13,959 – The downward trendline can also be used to identify selling points.
- Price Target 1: 13,730 – Month to date price low recorded on 18th April 2022.
- Price Target 2: 13,00 – Psychologically important ‘big number’ support level which sits just above the year-to-date low of 12,944 recorded on 15th March 2022.
- Stop Loss: > 15,275 – High of the double-top price pattern.
FTSE 100
In line with other stock indices, the FTSE 100 recorded a down week, but it outperformed the S&P 500 and NASDAQ 100 index.
11th – 19th April 2022
- FTSE 100 down 0.59%
- S&P 500 down 1.66%
- NASDAQ 100 down 2.31%
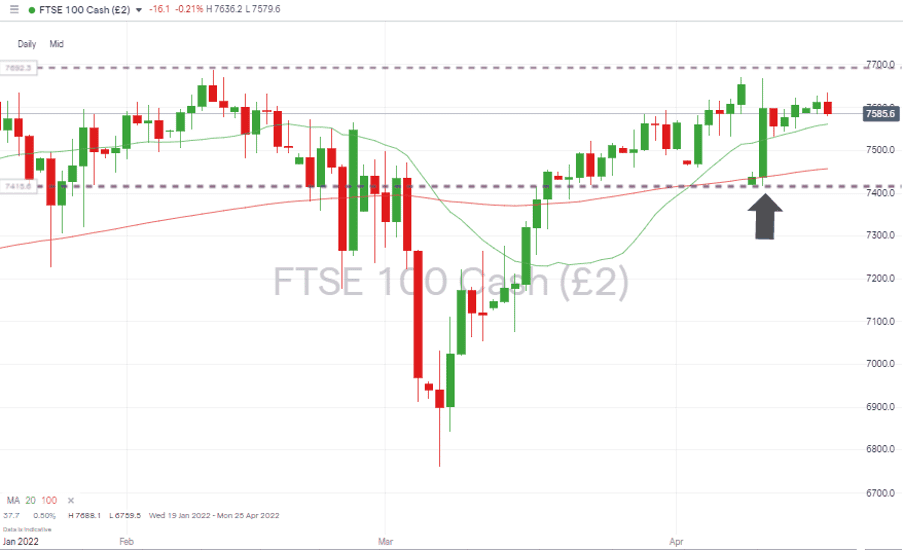
The bounce off the 100 SMA on the Daily Price Chart, which took place on 11th April 2022, provides an indication of the price level where buyers are willing to step in and buy the dips. Further upside is potentially capped by the year-to-date price high of 7,688 recorded on 10th February 2022.
FTSE 100 Daily Price Chart – Trading between key support and resistance levels
Source: IG
Long positions
- Entry Level 1: 7,561 – Region of the 20 SMA on the Daily Price Chart. Using small pullbacks as a chance to buy in to bullish momentum.
- Price Target 1: 7,688 – Year-to-date high recorded in February.
- Price Target 2: 7,903 – In extension, price high of May 2018.
- Stop Loss: < 7,457 – Region of the 100 SMA on the Daily Price Chart.
Oil
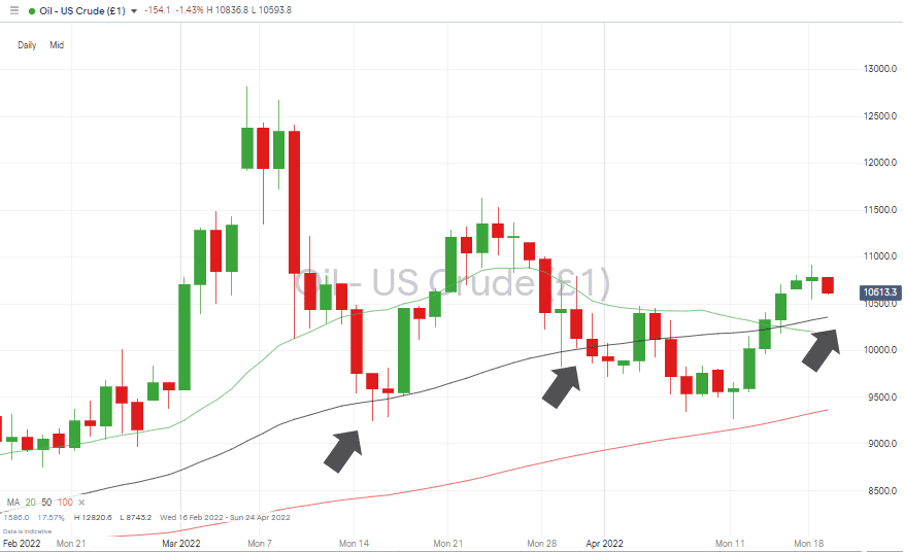
After posting five up days in a row, oil has started the week with a sequence of red hourly candles. That looks more like price taking a break rather than a reversal. The 100 SMA on the Daily Price Chart could be the region to step in and build on any (now in profit) long positions which were put on thanks to this report.
US Crude Oil – Daily Price Chart – Support provided by 100 SMA
Source: IG
Long positions
- Entry Level 1: 106.09 – Using the 50 SMA on the Hourly Price Chart as a guide for trade entry points
- Entry Level 2: 103.55 – A more conservative entry point based on the 50 SMA on the Dailly Price
- Price Target 1: 116.31 – Price high of 23rd March 2022.
- Stop Loss: < 99.50 – Just below big number price support.
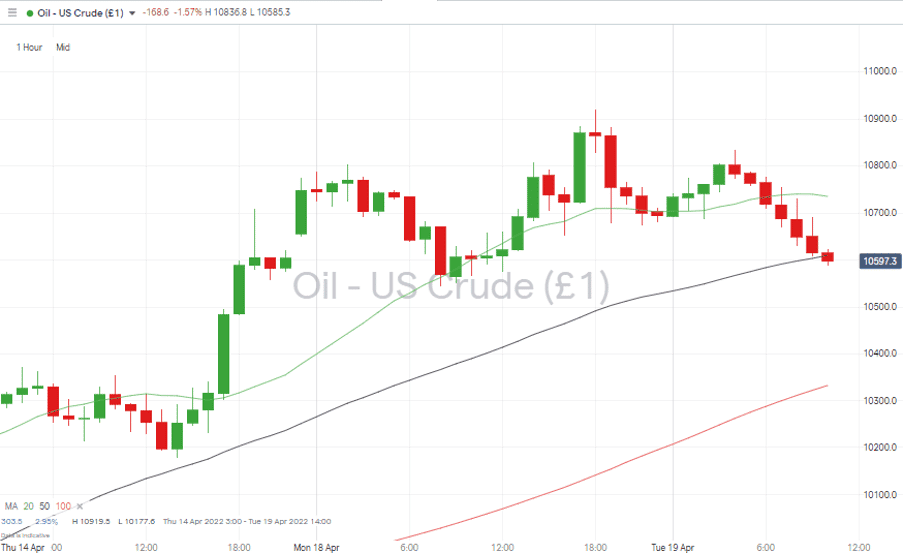
US Crude Oil – Hourly Price Chart – Price consolidation
Source: IG
Forex
EURUSD
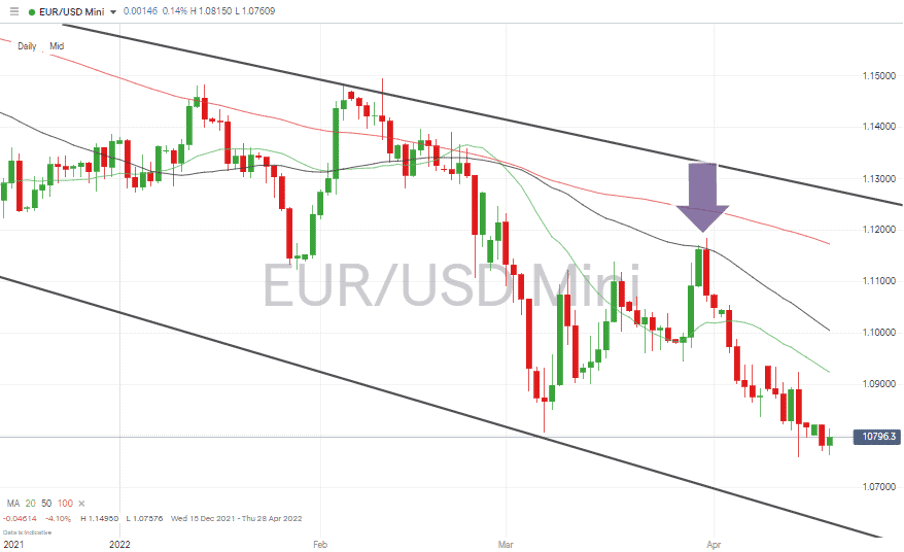
The euro’s weakness continues, and those who sold short EURUSD on the back of last week’s report will be showing profits on their trades. Long-term fundamentals are in play in the form of the looming French presidential election. Still, the ECB monetary policy meeting on Thursday, 22nd April 2022, looks likely to dominate short-term investor sentiment.
EURUSD – Daily Price Chart – Bearish Indicators & 50 SMA Resistance
Source: IG
Short positions
- Entry Level 1: 1.092 – Region of the 20 SMA.
- Price Target 1: 1.0636 – Region of supporting trendline of downwards price channel.
- Stop Losses: > 1.1004 – Current region of the 50 SMA and psychologically important price level.
Gold
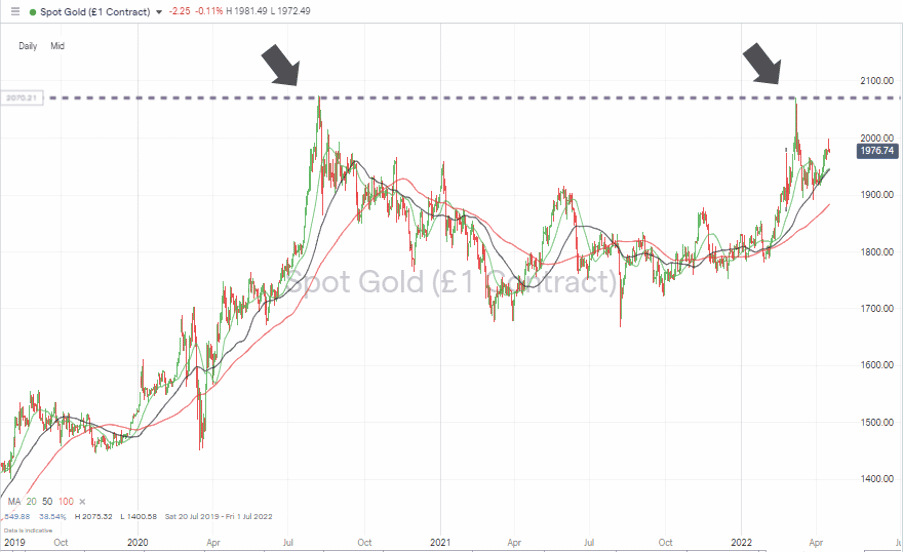
Last week, the move into risk-on assets wasn’t matched by the selling pressure on gold. This is another disconnect between asset groups which suggests equity bulls might want to proceed with caution. The metal’s double-top price pattern still puts a limit on an upward price movement, but while price is consolidating above $1,900, a retest of the $2,100 price range can’t be discounted.
Gold – Monthly chart – Double-Top price pattern
Long positions
- Entry Level 1: 1,944 – 1,946 – Region of both the 20 and 50 SMAs on the Daily Price Chart. Both metrics have in recent months proved reliable entry points for long positions.
- Price Target 1: 2,070 – ‘Double-Top’ price highs printed in August 2020 and March 2022.
- Stop Loss: < 1,881 – Region of the 100 SMA on the Daily price chart.
Crypto – Bitcoin & Ethereum
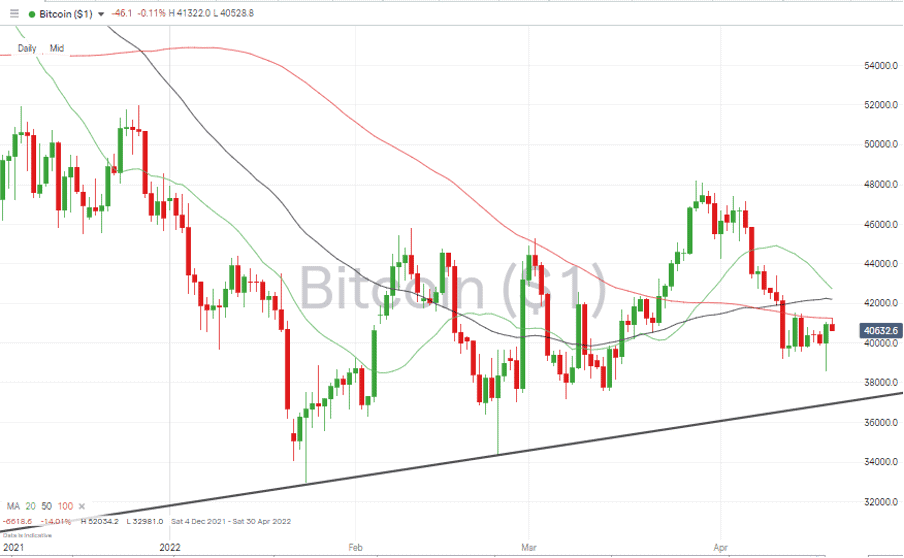
Both of the crypto market’s big coins posted a second negative week in a row, but the respective moves of -3.7% and -4.4% in Bitcoin and Ether look more like price consolidation than a substantial shakedown.
Bitcoin – Daily Price Chart – Price consolidation
Source: IG
Bitcoin Long positions
- Entry Level 1: 41,261 – Using a breakout strategy and trading any break above the 100 SMA on the Daily Price Chart, which is currently in the region of 41,260.
- Entry Level 1: 37,089 – Using the supporting trendline as a signal to open a long position.
- Price Target 1: 50,000 – ‘round number’ resistance.
- Price Target 2: 51,800 – Intraday low of December 3rd 2022 – using a gap-fill strategy.
- Stop Losses 1: < 34,350 – Price low of February 24th 2022.
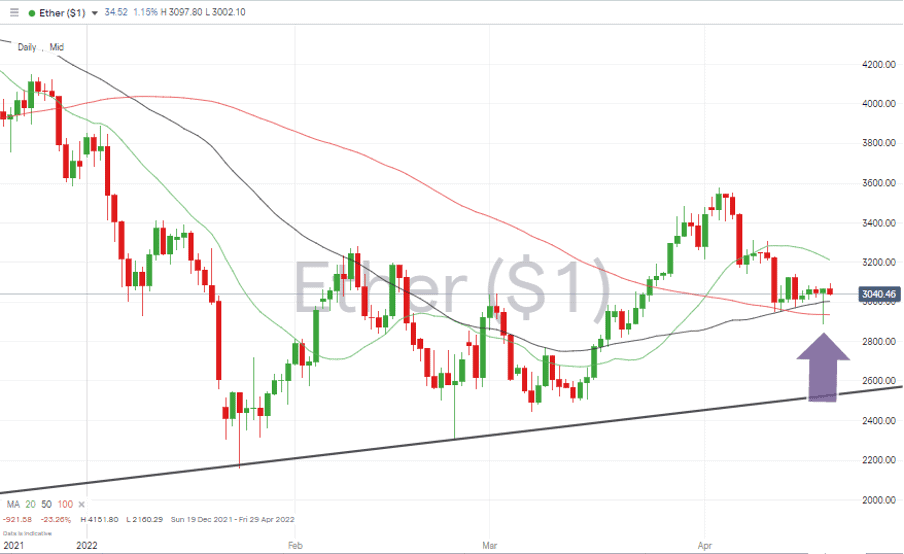
Ethereum – Daily price chart – Trendline still intact and SMA offering support
Source: IG
Ethereum Long positions
Ether’s double-bottom or triple-bottom price pattern formed by the price lows of February and March still holds, with the recent price weakness being in line with historical volatility levels.
- Entry Level: 3,003– Region of 50 SMA on Daily Price Chart and ‘big number’ price support level of 30k.
- Price Target 1: 3,580 – Price high of 3rd April 2022.
- Price Target 2: 4,000 – Psychologically important ‘round number level, which acted as support in December and now has the potential to act as resistance.
- Stop Losses: < 2,872 – Closing price of 13th Feb 2022.
Risk Statement: Trading financial products carries a high risk to your capital, especially trading leverage products such as CFDs. They may not be suitable for everyone. Please make sure that you fully understand the risks. You should consider whether you can afford to take the risk of losing your money.

Forextraders' Broker of the Month
BlackBull Markets is a reliable and well-respected trading platform that provides its customers with high-quality access to a wide range of asset groups. The broker is headquartered in New Zealand which explains why it has flown under the radar for a few years but it is a great broker that is now building a global following. The BlackBull Markets site is intuitive and easy to use, making it an ideal choice for beginners.