
Instrument | Price | Hourly | Daily |
EUR/USD | 1.0876 | Strong Sell | Strong Sell |
GBP/USD | 1.2990 | Strong Sell | Strong Sell |
USD/JPY | 125.36 | Strong Buy | Strong Buy |
S&P 500 | 4,470 | Sell | Neutral |
NASDAQ 100 | 14,249 | Strong Sell | Strong Sell |
FTSE100 | 7,649 | Strong Buy | Strong Buy |
Gold | 1,942 | Neutral | Strong Buy |
Crude Oil WTI | 95.90 | Strong Sell | Strong Sell |
Bitcoin | 42,266 | Strong Sell | Strong Buy |
Ethereum | 3,177 | Strong Sell | Strong Buy |
UTC 09:10
Our trading signal analysis is based on a comprehensive summary of market data. We use a range of metrics with weighting given to simple and exponential moving averages and key technical indicators.
We created this Weekly Tips section to share possible trade entry and exit points based on our technical analysis. We also have other methods to validate our trades that we can’t publicly share that help to increase their success. All our trades include entry and at least one target price. Stop losses are applied at the reader’s discretion. Our strategies typically trade with a wide stop loss, and risk is further mitigated by trading at a small size.
The FTSE 100 equity index, the euro-dollar currency pair, and crypto market indicators point towards short-term strength and long-term weakness. Trading decisions need to be made with holding periods in mind, and choppy market conditions could prevail in the run-up to the Fed’s big announcement.
FOCUS ON: Traditionally Strong Q2 Comes Into Play
Risk-on assets, including the NASDAQ 100 index, had a solid start last week, but the subsequent slide has posted several bearish signals, including a double-top pattern in the Daily Price Chart. The demise of the bulls came before the US Federal Reserve’s release of the minutes of the last meeting, which isn’t too much of a surprise considering that the price was already beginning to look overextended. The fact that those minutes laid out the potential for 50 basis point interest rate rises in the future certainly added to the woes of those who didn’t sell out of the recent rally early enough.
- NASDAQ 100 Index – Down 5.52% between Tuesday 5th April and Friday 8th
- FTSE 100 Index – Up 1.31% between Monday 4th April and Friday 8th
The increasingly hawkish signs from the Fed will ensure fiscal policy doubts will cast a shadow over the market, but in the coming week, it is the US earnings season that looks set to be used as a steer on which way the market will head.
Big banks kick the season off with JP Morgan releasing earnings data on Wednesday, and Wells Fargo, Goldman Sachs, and Citigroup share their numbers on Thursday. The days of everyone owning bank shares might be long gone, but the role these firms play in the financial market infrastructure means their reports of this week could have far-reaching consequences.
News and fundamentals can be expected to be the major price driver in the oil markets. This report of last week picked out the possibility for WTI crude to test the $100 price bar one more time before selling off. As suggested, the price did overshoot the big number resistance level, cleared out stop losses on existing short positions, and reached our entry point of $104.16 before finishing the week at $95.58.
Indices
NASDAQ 100
Last week’s proposal to trade the channel between the 61.8% Fibonacci retracement level (15,245) and the 50% Fib (14,835) panned out as expected and even left time to trade the breakout to the downside that occurred on Wednesday.
The underlying sentiment for tech stocks remains bearish. Still, a relief rally from last week’s sell-off can’t be discounted, particularly with earnings season approaching and the potential for some ‘market beats’ surprising analysts to the upside.
Nasdaq 100 Chart – 1Day Candles – Rangebound Trading Within Fib Retracement Levels
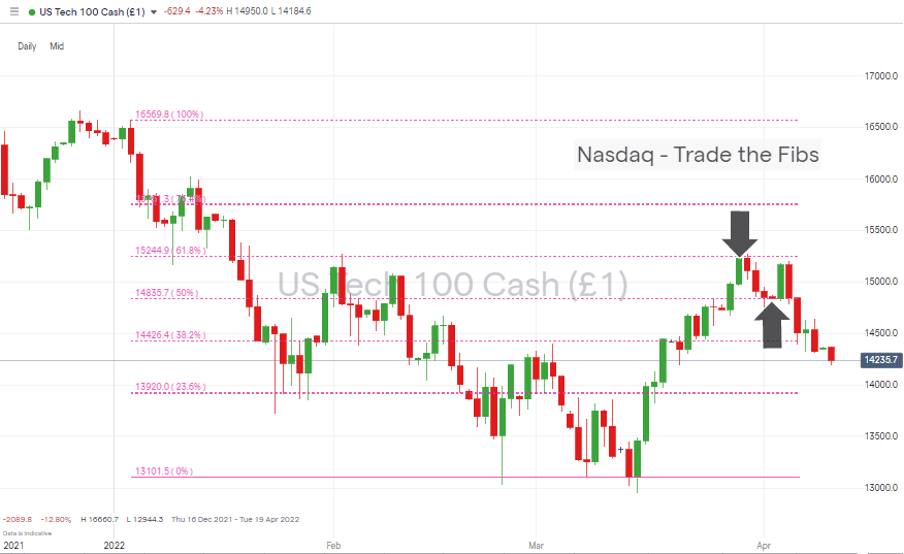
Source: IG
Nasdaq 100 Chart – 1Day Candles – Downwards Breakout of Fib Retracement Levels
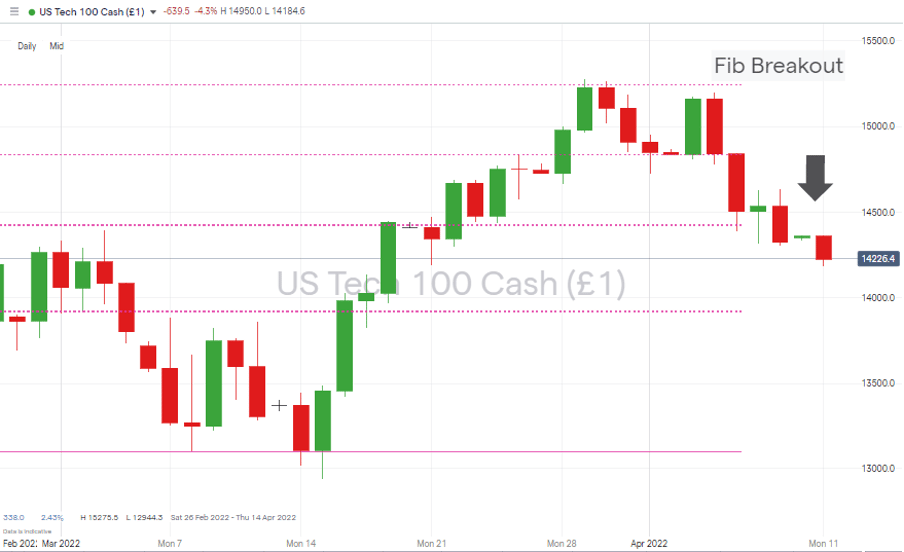
Source: IG
Long positions
- Entry Level 1: 14,208 – 50 SMA on Daily Price Chart.
- Entry Level 2: 14,076
- Price Target 1: 14,444 – Region of 50 SMA on Daily Price Chart
- Price Target 2: 15,275 – High of 29th March. Price needs to trade above this level to confirm a bullish rather than a bearish pattern, so it will be an area of significant resistance.
- Stop Loss: < 13,920
Nasdaq 100 Chart – 1Day Candles – Double Top?
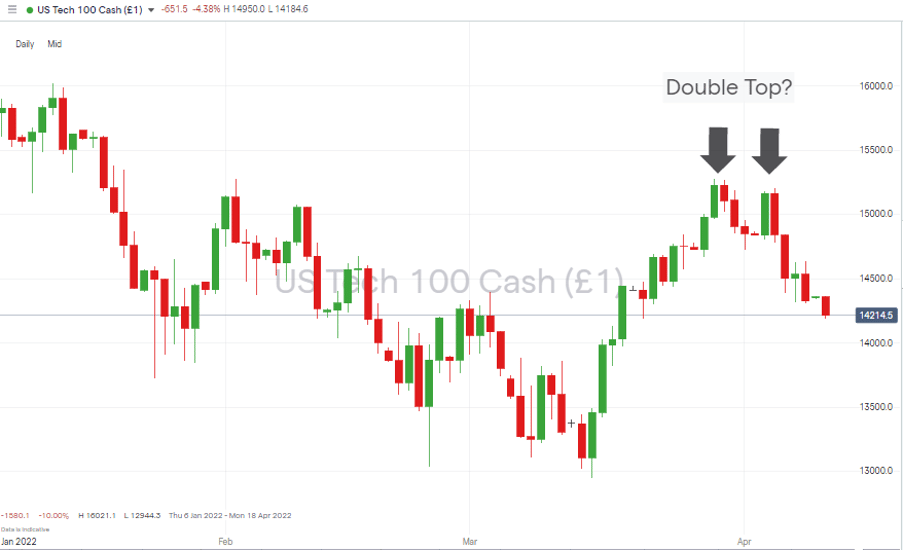
Source: IG
FTSE 100
The characteristics of the firms that make up the FTSE100 index continue to create moments when its performance diverges from the major US indices. While the big North American benchmark indices declined last week, the FTSE 100 posted a +1% gain, in line with our 4th April forecast for blue-chip UK stocks.
Technical indicators point to the path of least resistance continuing to be upward but require a close above 7,651. Price is simultaneously supported by the 50 and 100 SMAs on the Daily Price Chart, which sit near each other in the range of 7400 – 7450.
FTSE 100 Daily Price Chart – Reaching Key Resistance Level of 7651
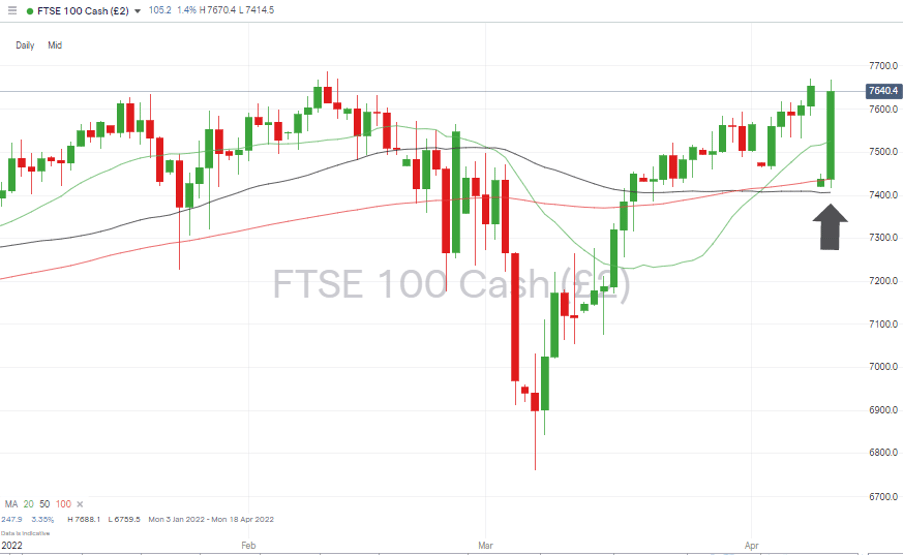
Source: IG
Long positions
- Entry Level 1: 7,651 – Pullback trading strategies have recently been successful, but with price buffering price levels not seen for 24 months, any long position would need to be based on a breakout strategy.
- Price Target 1: 7,688 – Year-to-date high recorded in February.
- Price Target 2: 7,903 – Price high of May 2018.
- Stop Loss: < 7,400 – Region of the 50 and 100 SMA’s on the Daily Price Chart. Big-number price support level and price low of the week commencing 11th April.
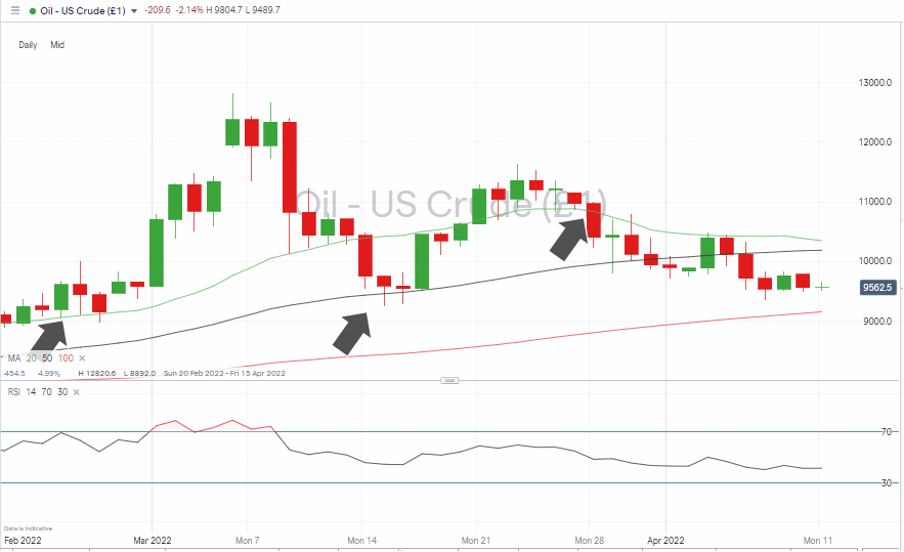
Oil
Last week’s sell-off in oil was partly triggered by technical indicators – the bull run just ran out of steam on some key weekly metrics. With price back trading between the 50 and 100 SMA on a Daily Price Chart, there appears more chance for news events and fundamental analysis to act as a catalyst for the next move.
Last week’s oil report had a bias for short positions and captured a +8% sell-off, but following the sell-off, our short-term view on the price of crude has swung to be bullish.
US Crude Oil – Daily Price Chart – Still Tracking the 20 SMA
Source: IG
Long positions
- Entry Level 1: 91.54 – Using the 100 SMA on the Daily Price Chart and the psychologically important price level of $90 as a guide.
- Price Target 1: 92.44 – Price low of 15th March.
- Stop Loss: < 90 – Big number price support.
Forex
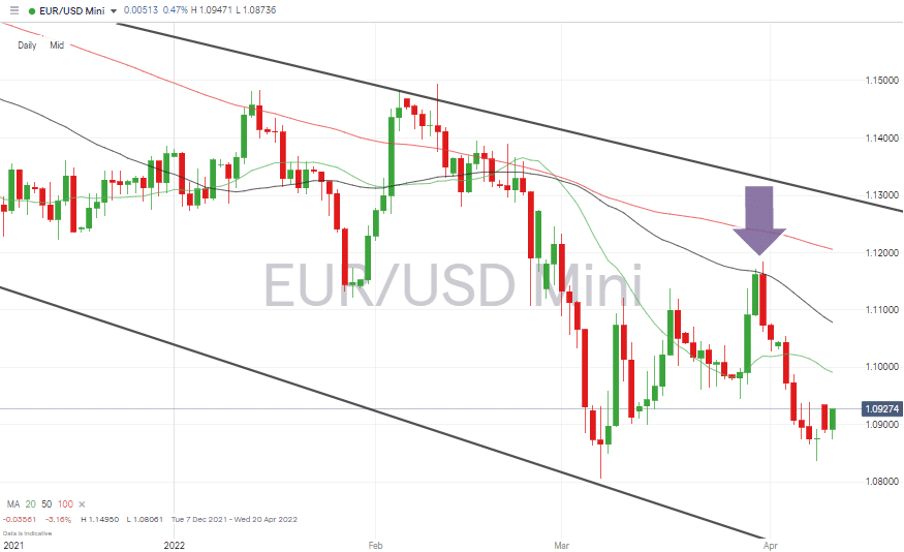
EURUSD
Euro’s price rise and subsequent fall last week highlights a trading range being established between the 50 and 100 SMA’s on the Daily Price Chart. With price holding above the key 1.10 price bar and support from the 20 SMA also coming into play, there is every chance price can bounce off the supporting trend line and push on upward from here.
The underlying prospects for EURUSD remain bearish, and downwards momentum picked up last week when the supporting trend line dating back to 7th March was broken. The 50 SMA on the Daily Price Chart has acted as a reliable indicator of when to join in with short positions and currently sits in the region of 1.107.
EURUSD – Daily Price Chart – Bearish Indicators & 50 SMA Resistance
Source: IG
Short positions
- Entry Level 1: 1.1078 – Region of the 50 SMA which acted as resistance on 30th March.
- Price Target 1: 1.0806 – Price low of 7th March.
- Price Target 1: 1.0660 – Region of supporting trendline of downwards price channel.
- Stop Losses: > 1.1205 – Current region of the 100 SMA.
Crypto – Bitcoin & Ethereum
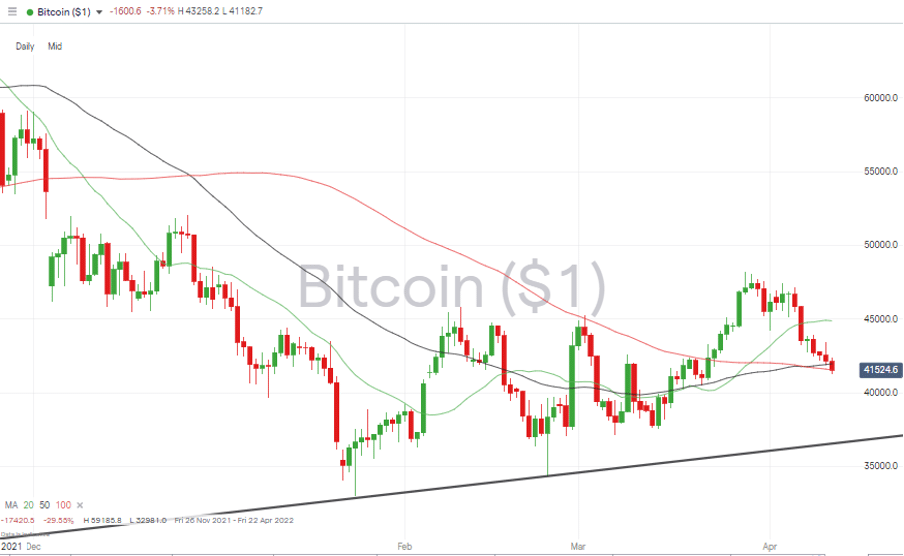
Both of the crypto market’s big coins gave up 8% last week, but this could be a chance to buy a dip in a longer-running upward trend. Bitcoin’s upward trend line is still intact, and its price is currently consolidating in the region of the 50 and 100 SMAs on a Daily Price Chart.
Bitcoin – Daily Price Chart – Price consolidating at key SMA support level
Source: IG
Bitcoin Long positions
- Entry Level 1: 41,561 – Region of the 100 SMA on the Daily Price Chart.
- Price Target 1: 50,000 – ‘round number’ resistance.
- Price Target 2: 51,800 – Intraday low of 3rd December – using a gap-fill strategy.
- Stop Losses 1: < 40,000 – Psychologically important price level.
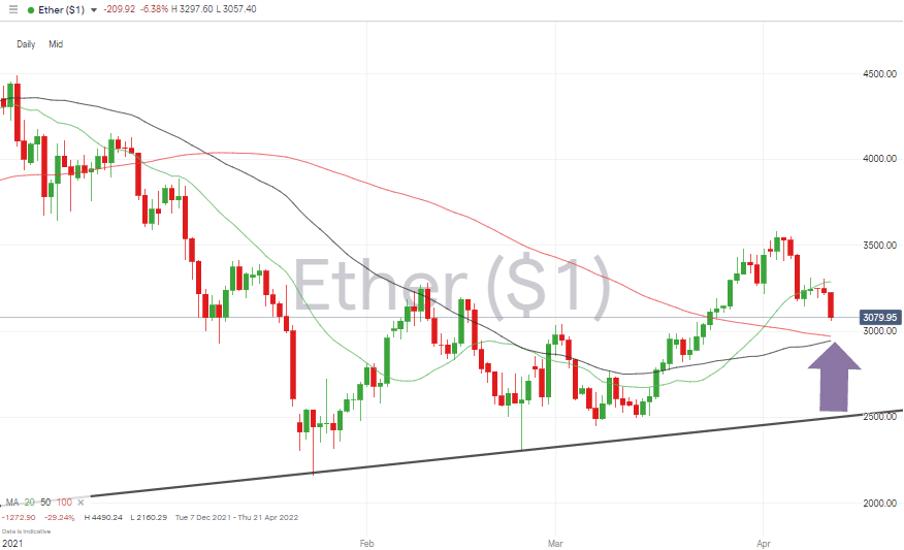
Ethereum – Daily price chart – Trendline Still Intact Despite Recent Sell-Off
Source: IG
Ethereum Long positions
Ether’s double-bottom or triple-bottom price pattern, formed by the price lows of February and March, could still come into play. The recent sell-off follows a multi-week rally, and a price move into the region of the 50 and 100 SMA’s would represent an opportunity to buy the dip.
- Entry Level: 2,945 – 2,970 – Region of 50 and 100 SMA’s on Daily Price Chart.
- Price Target 1: 3,580 – Price high of 3rd April.
- Price Target 2: 4,000 – Psychologically important ‘round number’ level, which acted as support in December and now has the potential to act as resistance.
- Stop Losses: < 2,872 – Closing price of 13th Feb.
Risk Statement: Trading financial products carries a high risk to your capital, especially trading leverage products such as CFDs. They may not be suitable for everyone. Please make sure that you fully understand the risks. You should consider whether you can afford to take the risk of losing your money.

Forextraders' Broker of the Month
BlackBull Markets is a reliable and well-respected trading platform that provides its customers with high-quality access to a wide range of asset groups. The broker is headquartered in New Zealand which explains why it has flown under the radar for a few years but it is a great broker that is now building a global following. The BlackBull Markets site is intuitive and easy to use, making it an ideal choice for beginners.