In a previous chapter in our forex training course, we discussed what technical analysis is. In this section, we’ll take a look at the various indicators and patterns that are used in technical analysis.
The most basic tool of the technical analyst is the chart which depicts price action during a specified time period. Charts are useful for giving us historical information, and they can provide a snapshot of the market at the moment they are drawn.
Let us look at the two main types of charts according to how they depict price movements:
Line Charts
The line chart is simply a graph of price points connected by lines. The vertical axis, as shown in the symbolic chart below, depicts prices, and the horizontal axis matches a particular time to each price quote on the vertical axis. Line charts are pretty simple and straightforward and the trader will have no difficulty in getting used to them with a tiny amount of practice.
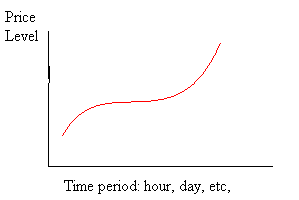
The advantages provided by line charts are in clarity and simplicity: instead of cluttering the vision with highs, lows, opens and closes, the line chart gives a historical picture of the underlying trend, and the trader is free to make his interpretations. The line chart is perhaps best used to supply the trader with a basis on which he can build his trading strategy. Once he’s got a grasp of the underlying movement, he can use other, more detailed charting tools to precisely define where and when he will move to make a trade.
Candlestick charts
By the standards of technical analysis, the candlestick method is ancient. Its origin is thought to be 18th century Japan, and legend credits a certain Homma Munehisa with its invention.
The candlestick chart packs a lot of information in a very concise and useful form: Let’s see an example in the graphic below:
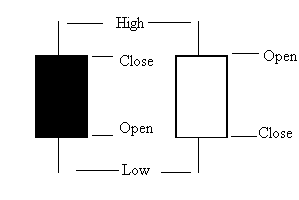
The black candlestick signifies a market session that closed on a higher price quote. Conversely, the white candlestick tells us that the prices closed lower. The body of the candlestick shows the open and close values (when depicted on a price chart), and the top and bottom edge of the wick shows the highest and lowest values for the session.
Let us see the various types candlesticks the trader can encounter on any chart:
-
- Hammer – a bullish pattern during a downtrend (long lower wick and small or no body); Shaven head – a bullish pattern during a downtrend & a bearish pattern during an uptrend (no upper wick); Hanging man – bearish pattern during an uptrend (long lower wick, small or no body; wick has the multiple length of the body.
- Inverted hammer – signals bottom reversal; Shaven bottom – signaling bottom reversal, the hammer has no lower wick; Shooting star – a bearish pattern during an uptrend. The candlestick has a small body, a long upper wick, and a small or non-existent lower wick)
- Doji – the candle body is squeezed to a thin line, neutral signal.
- Long legged doji – signals a top reversal
- Dragonfly doji – when there’s no upper wick, and a long lower wick, the candlestick signifies a trend reversal to the bullish side.
- Gravestone doji – when there’s a long upper wick, and no lower wick, the candlestick signals a trend reversal to the bearish side.
- Marubozu white – no wick, depicts a beginning or continuing bullish trend.
- Marubozu black – no wick, depicts a beginning or continuing bearish trend.
Key Points
- Charts are the most basic technical analysis tool available to the Forex trader. The two main types are line charts and candlestick charts
- Line charts are the easiest to understand and simply show price points at set intervals connected by a line
- Candlestick charts are more advanced as they show more information about price movements
- Candlesticks can form various patterns that can provide valuable information about price movements
Further Reading
More Free Forex Lessons
subscribe to get a FREE BONUS LESSON, plus course updates, trade ideas and market news - straight to your inbox

Forextraders' Broker of the Month
BlackBull Markets is a reliable and well-respected trading platform that provides its customers with high-quality access to a wide range of asset groups. The broker is headquartered in New Zealand which explains why it has flown under the radar for a few years but it is a great broker that is now building a global following. The BlackBull Markets site is intuitive and easy to use, making it an ideal choice for beginners.