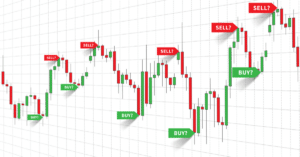
How would you like to learn about a technical trading system that has been in use for over 300 years with great success? Japanese commodity traders have been employing candlestick formations since the 1700s. These rather simple displays of basic trading information for a given period of time are so common today in our technical charts that we sometimes forget what a long heritage these formations have had. These curious patterns have also been given clever names, as per the graphic depicted below:
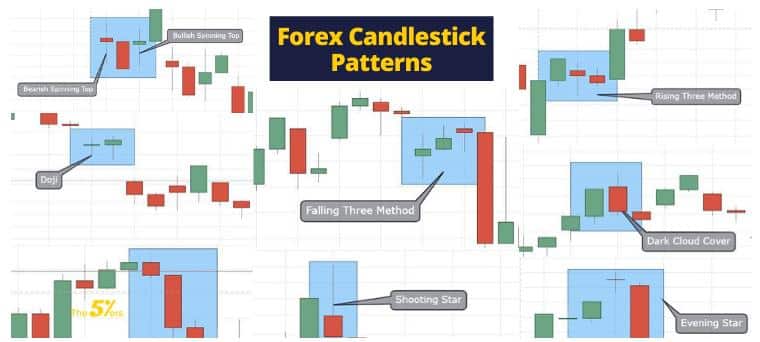
Source: The5ers.com
Whether it is a single candle or a group of them appearing in succession, the insights that can be gathered immediately with one visual look can support a successful trading strategy on their merits alone. No-one is suggesting that you abandon your preferred technical indicators and begin trading by only looking at candlestick patterns. Candles, like other indicators, can give false positive signals. Their effectiveness is always enhanced when combined with another technical tool, whether it is an indicator, alternate pattern recognition sources, or simply levels of support and resistance.
The origin of forex candlestick patterns can be traced back to rice traders in Japan in the 18th century. One very famous rice trader by the name of Honma Munehisa (1724-1803) is said to have invented this charting technique. From his base in Sakata, Japan, he flourished when an active futures market embraced the local rice trade. He became known as the ‘God of Markets’ and published in 1755 what many claim to be the first book about investor and market psychology.
The spread of candlestick pattern trading techniques is a relatively new phenomenon in Western financial markets. It had been popularized by Charles Dow in the US nearly a century ago, but it was not until 1991 that Steve Nison published his definitive volume Japanese Candlestick Charting Techniques, and alerted traders and investors far and wide of the effectiveness of this technique. Bar and line charts soon gave way to candlesticks, which are now the standard on most forex trading platforms.
The importance of learning just the basics of this graphical system cannot be overstated. Candles are no longer a secret among a selected few. Traders and investors understand the insights they convey and will instantly respond accordingly in forex, stock and commodity markets. If you are not aware of apparent candlestick signals, you could easily miss worthy trading setups or, worse yet, have the market move suddenly against your active plan at hand.
Understanding price behaviour and how its present state might project into the future is the essence of successful trading. A basic knowledge of candlestick patterns can provide an edge, which is all that is needed to win over the long term. How much study in this area is enough? We will give you the basics in the following paragraphs – you will learn the details of their structure, their inherent benefits, and the most popular and common forms. We will also provide links to more definitive information, if you wish to expand your knowledge base.
What Is a Candlestick Chart?
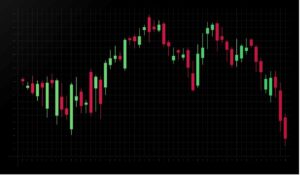
Candlestick charts have been a solid staple of every forex trader on the planet for decades, but the best way to learn about their uniqueness and why they have become a formidable tool in the trader’s technical toolbox is to start with the formatting of a single simple candle.
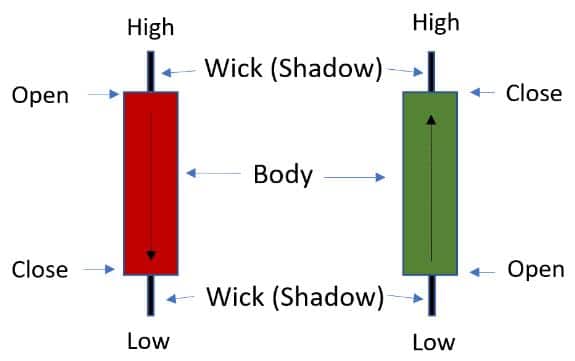
Source: Therobusttrader.com
A single candle conveys the open, close, high and low for a specified time period, as well as whether the market was bearish or bullish in its behaviour. The ‘body’ is the small box that begins at the opening price and concludes at the closing value. The lines above and below the body reflect the high and low for the period. These lines have commonly been referred to as wicks or shadows or even tails in some instances. Colouring conventions vary across platforms. In this case, red is bearish and green is bullish. Black and white are also common.
In the chart settings section of your trading platform software, traders can choose between candles, bars and lines or any other method supported by their respective systems provider, when customising the features and formatting of their pricing charts. After choosing a timeframe for the price chart, the candlesticks are automatically calculated and presented on the chart based upon previous pricing data.
Although the formatting constraints seem rather simplistic, there is a veritable multitude of shape possibilities, and, when taken as a group, as in the ‘Falling Three Method’ depicted in the introduction, the number of possibilities can be quickly multiplied. Interpreting these visual snippets has become a technical art form, but these patterns often signify that an imminent reversal is in the works or that a previous trend will more than likely continue.
The Benefits of Candlestick Charts
Candlestick patterns forex recognition carries with it a number of benefits. First, the visual representation of pricing behaviour is instantly conveyed. Colouring conventions illustrate gains and losses for a period in an easily recognizable fashion without the need to draw extra lines or employ other charting mechanisms. When two or more candles form a common pattern, there is an immediate insight as to what might transpire in the near term. Learning the various names of the more common ones is not that difficult, and each one has stood the test of time.
Incorporating candlestick recognition in your daily routine can give you an advantage over the long term. Using additional technical tools can confirm the direction suggested by the pattern at hand, whether a reversal or a minor pullback before a continuation of a previous trend. Not every trader, however, is cut out to be good at pattern recognition. For this subset of the trading community, candlesticks may only add clutter to the chart and could misrepresent where the market is headed for those who do not understand how candlesticks are to be used.
The Most Popular Candlestick Patterns
We have listed 10 of the most popular candlestick patterns below, though ones such as the star and the tweezer have a few variations on the same theme. The importance of these forms may also depend upon their location and if other important candles precede or follow the primary one. Size may also matter when observing the various bodies and wicks. Various sizes can gauge the strength or weakness of a signal or indecision in the market.
Books have been written on these curious little shapes, and interpretations can actually vary in the literature. We have only provided a brief recap of the more common ones, but if you should wish to continue your search for knowledge, we have included a link to a page that will present more information, actual pictograms, and how to trade each candlestick pattern. Learn to combine candlestick insights with other technical tools and your trading prowess will improve.
- Doji: Perhaps the simplest candlestick, a doji occurs when the closing and opening prices are very nearly the same. It looks as though there is a horizontal line with wicks attached. Market indecision is suggested, but if the wick is missing on either side of the line, then the doji might market the end of an up or downtrend.
- Hammer: The hammer is another common shape, earning its name as it actually looks like one. A small body forms at or near the closing price with little or no upper wick and a long lower wick. For a downtrend, it is seen as a bullish sign. If the hammer is inverted, it can be interpreted as a bearish sign for an uptrend.
- Evening star: Our first grouping of three candles in a row is considered to be rare, but when it appears, it signals the end of a bullish trend. One up candle is followed by a smaller up candle, which can be a doji or an inverted hammer, and the second body can gap above the previous candle’s body. The third candle must be a down candle, which typically closes within the body of the first candle.
- Morning star: This three-candle pattern is the opposite of the evening star and occurs at the potential ending of a bearish trend. In this case, a down candle is followed by a doji or hammer, which can be up or down, but the sequence requires an up candle that closes within the body of the first candle.
- Engulfing: Another popular pattern is an engulfing candlestick, which requires two candles. It can be both bearish and bullish, depending upon the colour of the bodies. In the bullish case, a red candle’s body must be fully engulfed by the green candle body that follows it. Buyers have aggressively overtaken sellers.
- Dark cloud cover: This pattern is a bearish reversal signal. A green candle is followed by a red candle, but its open must gap above the previous close, and its close must fall between the midpoint and opening price of the previous candle.
- Hanging man: This shape resembles a hammer, but to be considered a hanging man, the wick on the bottom must be two or more times the size of the body at the top. It signals a bullish reversal of a downtrend and a bearish reversal of an uptrend.
- Harami: This pattern is the engulfing pattern in reverse, but traders look for a third candle to form to provide a reliable bullish reversal, sometimes called the bullish three inside up pattern. The first red down candle is larger, suggesting seller complacency, especially when the second candle is green and engulfed, while the third candle closes at an even higher value.
- Marubozu: The rough translation of Marubozu is ‘shaved head’, and it is a single body with no wicks. Its appearance is rare, and it is not particularly popular as its signal from a standalone position is unclear. When combined with other candlesticks, you may arrive with what is called a bullish kicking pattern.
- Shooting star: This shape is actually an inverted hammer, a solid body at the bottom with an extended wick above. It signals the end of a bullish trend.
- Spinning top: This candle resembles a doji, but it has a small body in the middle with wicks on both ends. Wicks may appear equal, but sizes can vary. This pattern reflects indecision in the market.
- Tweezer top: Two candles with the same top formation, either wicks or no wicks. The longer the wicks, the stronger the signal, especially when followed by an engulfing candle in the opposite direction. It signals an imminent reversal.
- Tweezer bottom: The opposite of a tweezer top, signalling an uptrend.
Conclusion
Using technical indicators and levels of support and resistance are keys to successful forex trading, but pattern recognition also ranks as a key trait to acquire, and candlestick patterns are one of the best tools to facilitate this recognition ability. Candlestick charts are now the most popular method for presenting pricing behaviour in the forex world, preferred over both line and bar varieties on forex trading platforms.
We have provided the basics here, but there is an abundance of information on this topic on the internet. As with any technical tool that depends on previous pricing behaviour, candlestick pattern recognition is not perfect. Its effectiveness can be enhanced by using complementary technical techniques to help you tilt the odds in your favour.
Trade Candlestick Patterns with Top Forex Brokers
| Broker | Features | Regulator | Platforms | Next Step | |
|---|---|---|---|---|---|
 Your capital is at risk
Founded: 2014 Your capital is at risk
Founded: 2014 |
|
FSPR | MT4 | ||
 Your capital is at risk
Founded: 2006 Your capital is at risk
Founded: 2006Europe* CFDs ar... |
|
ASIC, FSA, FSB, MiFID | MetaTrader4, Sirix, AvaOptions, AvaTrader, Mirror Trader | ||
|
Between 74-89 % of retail investor accounts lose money when trading CFDs |
|
ASIC, FCA | MetaTrader 4, MetaTrader 5, cTrader | ||
|
|
|
ASIC, CySEC, IFSC | MT4 Terminal, MT4 for Mac, Web Trader, iPhone/iPad Trader, Droid Trader, Mobile Trader, MT5 | ||
 Your capital is at risk
Founded: 2006 Your capital is at risk
Founded: 2006 |
|
CySEC, DFSA, FCA, FSB, SIA | MetaTrader4, MetaTrader5, cTrader, FxPro Edge (Beta) | ||
|
|
|
CySEC, FSC, FSCA, MISA | MT4, MT5, OctaTrader | ||

Forextraders' Broker of the Month
BlackBull Markets is a reliable and well-respected trading platform that provides its customers with high-quality access to a wide range of asset groups. The broker is headquartered in New Zealand which explains why it has flown under the radar for a few years but it is a great broker that is now building a global following. The BlackBull Markets site is intuitive and easy to use, making it an ideal choice for beginners.