
Candlestick charts have been around for a very long time and were first used in the 1700s when a Japanese man named Honma developed this type of chart to help him track supply and demand in the rice trade.
The Western world was only introduced to the candlestick chart during the 1990s by the renowned technical analyst, author and speaker Steve Nison.
In this article, we will look at the popular doji forex pattern in particular, what it means when you see this pattern on a chart and how to trade it.
What is the doji pattern?
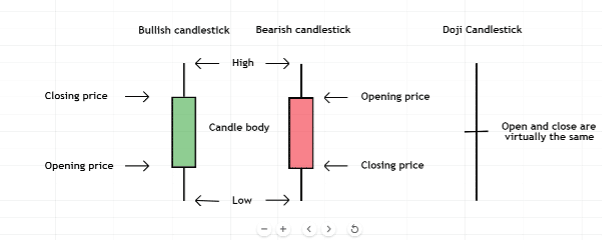
Image for illustration purposes only
Candlesticks display four important pieces of information: a market’s open, high, low and closing price for any selected timeframe.
When the closing price is higher than the opening price, then the candlestick’s body, or trading range, is coloured in green.
A candlestick with a red body represents a decline in price with the closing price lower than the opening price.
The doji forex candlestick, on the other hand, forms when the closing price is virtually the same as the opening price and looks like a cross or plus sign.
In some cases where there is a very small green or red body, technical analysts will still classify a candlestick as a doji for as long as the body size is no larger than 5% on the candle’s entire range.
Related Articles
- How to Trade the Hammer Pattern
- How to Trade the Marubozu pattern
- How to Trade the Shooting Star Pattern
- More Candlestick Patterns
What does the doji forex pattern mean?
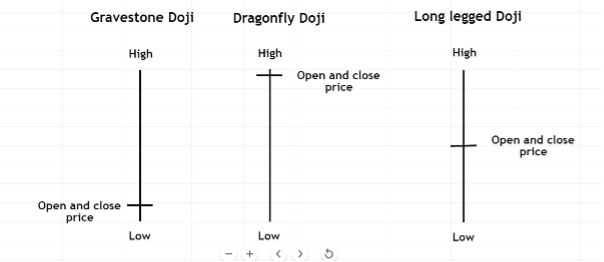
Image for illustration purposes only
There are three types of doji forex patterns: the gravestone doji, dragonfly doji and long-legged doji.
The word “doji” means blunder or mistake in Japanese, which refers to the rarity of a candlestick having the exact same opening and closing price.
On their own, doji patterns are considered neutral patterns where neither the buyers nor sellers of a market got the upper hand during a specified timeframe. When any of these patterns appear, they represent a period of indecision, which many analysts will interpret as an early warning sign that a reversal might occur.
How to trade the doji forex pattern
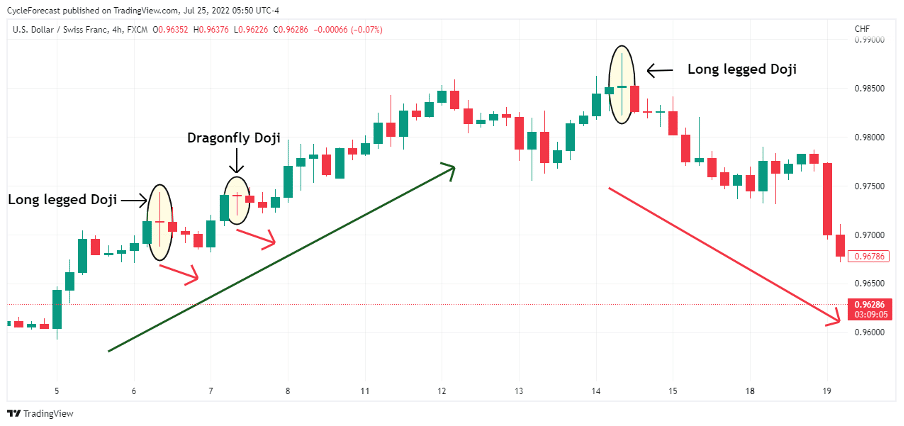
Image for illustration purposes only
The candlestick chart example above shows three instances where doji forex patterns formed during an uptrend before a major reversal occurred. Although small counter-trend reversals occurred after the first two doji patterns on the left, it was not until after the final long-legged doji on the right that a change in trend occurred.
It is, therefore, important to note that doji candlesticks can form at any stage during a trending market and that their appearance does not necessarily lead to a trend reversal. When it comes to trading the markets, analysts will often rely on various methods to make better trading decisions.
Below, you will find a couple of methods to help you spot the best doji forex patterns that may lead to the highest probability reversals.
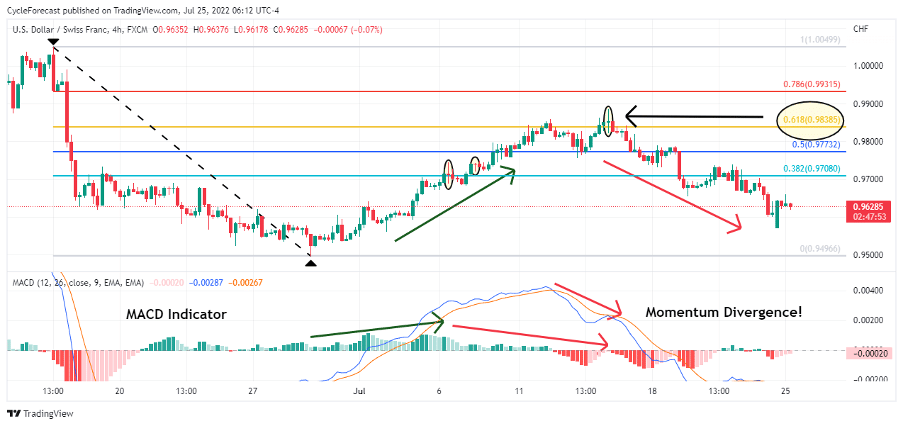
Image for illustration purposes only
Using the same chart as before, we zoomed out a bit to show more historical price action. Next, we used our Fibonacci retracement tool to draw our Fibonacci ratios from the high to the low of the downtrend that preceded the upward move we showed before.
Lastly, we added the MACD indicator in the lower panel of our chart. Both the Fibonacci retracement tool and the MACD indicator assisted in “filtering” out the doji forex patterns with the least probability of signalling a reversal.
During a corrective phase, as in our example, price will often find resistance at an important Fibonacci level. It was not until the second time around where price reached the important 61.8% Fibonacci level (a.k.a. the golden ratio) that the upward move found resistance and the previous downtrend continued.
The MACD indicator, on the other hand, was used to spot a decline in momentum during the upward move. Both trending and corrective phases generally start off with an increase in momentum, but when these phases near an end, momentum will often decline – leading to what analysts refer to as momentum divergence.
Note how the MACD histogram initially showed an increase in momentum (green bars on lower indicator panel), but towards the end of the corrective phase, momentum dried up before the final high.
The final doji forex pattern that formed appeared right at the 61.8% Fibonacci retracement ratio and after momentum divergence! These additional methods can greatly help a trader in identifying the doji candlesticks that might lead to the highest probability reversals.
The chart image below shows the trade levels that could have been used to sell this market.
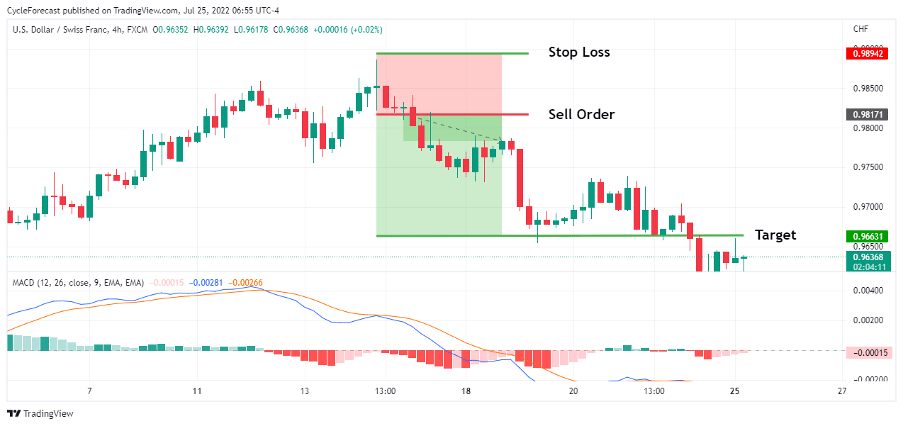
Image for illustration purposes only
The appearance of the doji candlestick in conjunction with the previous mentioned methods signalled that it was time to enter a short position.
After the doji candle closed, a sell order was placed a few pips below the candle with a stop loss a few pips above the same candle. In this trade example, a 2-to-1 reward vs. risk ratio was used to determine the target level, meaning that the trade was aiming for a potential profit that was double that of the potential loss.
Important side note: Some traders might argue that one should use a higher reward vs. risk ratio, but in the end, it comes down to your own risk tolerance. The rule of thumb is to always aim for targets that are larger than your potential loss and to never risk more than a few percentage points of your total account value on one single trade.
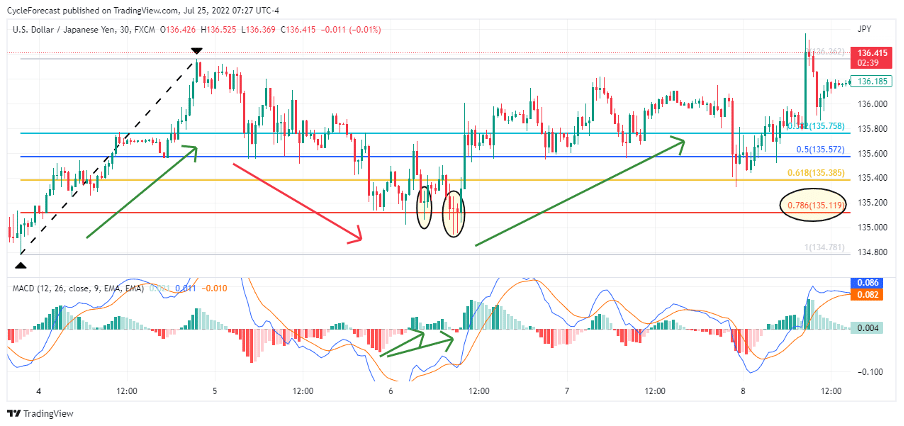
Image for illustration purposes only
Our final trade example shows two doji forex patterns that appeared at a 78.6% Fibonacci retracement level, right before a corrective phase ended. Here too, the MACD indicator showed clear momentum divergence before the price reversed higher.
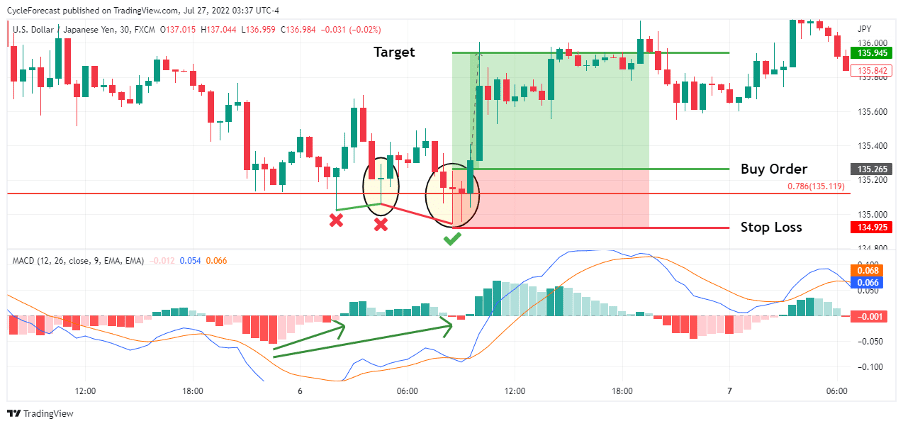
Image for illustration purposes only
A valid entry signal to buy this market only appeared after the second doji forex pattern. If you look closely, then the first doji candlestick (oval on the left) did not break below the previous low (red X on the far left).
Momentum divergence is best read between consecutive lower lows (as in this trade setup example). The first forex doji pattern, therefore, was not a valid entry signal. Soon after the first doji pattern, price broke below the previous low one last time, and a second doji candlestick formed. At that stage, momentum divergence was still present, and the first valid entry signal presented itself.
Important note: With this doji forex pattern strategy, it is therefore crucial to remain patient and to only enter a trade after the price reaches an important Fibonacci retracement level, with momentum divergence present between consecutive higher highs or lower lows. With these two conditions present, the first appearance of a doji candlestick then acts as the entry signal.
Conclusion
The doji forex candlestick pattern is probably the most well-known candlestick formation in trading, and although it is considered a neutral candlestick pattern, its appearance on a chart often leads to a reversal.
Not all doji candlestick patterns lead to reversals though, which is why we used the Fibonacci retracement tool and MACD indicator in our trading examples to help you make better-informed trading decisions.
Trade doji patterns with top forex brokers
| Broker | Features | Regulator | Platforms | Next Step | |
|---|---|---|---|---|---|
 Your capital is at risk
Founded: 2014 Your capital is at risk
Founded: 2014 |
|
FSPR | MT4 | ||
 Your capital is at risk
Founded: 2006 Your capital is at risk
Founded: 2006Europe* CFDs ar... |
|
ASIC, FSA, FSB, MiFID | MetaTrader4, Sirix, AvaOptions, AvaTrader, Mirror Trader | ||
|
Between 74-89 % of retail investor accounts lose money when trading CFDs |
|
ASIC, FCA | MetaTrader 4, MetaTrader 5, cTrader | ||
|
|
|
ASIC, CySEC, IFSC | MT4 Terminal, MT4 for Mac, Web Trader, iPhone/iPad Trader, Droid Trader, Mobile Trader, MT5 | ||
 Your capital is at risk
Founded: 2006 Your capital is at risk
Founded: 2006 |
|
CySEC, DFSA, FCA, FSB, SIA | MetaTrader4, MetaTrader5, cTrader, FxPro Edge (Beta) | ||
|
|
|
CySEC, FSC, FSCA, MISA | MT4, MT5, OctaTrader | ||

Forextraders' Broker of the Month
BlackBull Markets is a reliable and well-respected trading platform that provides its customers with high-quality access to a wide range of asset groups. The broker is headquartered in New Zealand which explains why it has flown under the radar for a few years but it is a great broker that is now building a global following. The BlackBull Markets site is intuitive and easy to use, making it an ideal choice for beginners.