

Candlestick charts are by far the most popular charting type among traders today because they offer a unique visual representation of trading behaviour for a selected time period. Technical analysts use them to “read” the investor sentiment of a market’s prices to help them determine when to enter and exit trades.
Just like technical chart patterns repeat in all markets and timeframes, so too do candlesticks repeat certain patterns that tend to forecast specific price behaviour.
In this article, we are going to take an in-depth look at the hammer forex pattern, what it means when this pattern shows up on your chart and how to trade it.
What is the hammer forex pattern?
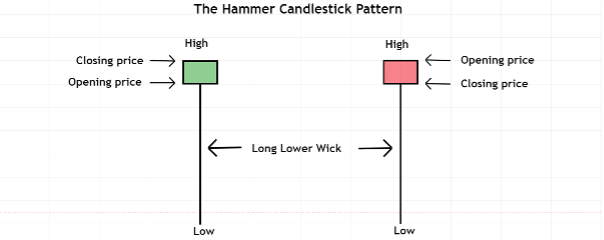
Image for illustration purposes only
The hammer candlestick pattern refers to the shape of a candlestick that resembles that of a hammer. This pattern forms when a market moves significantly lower after the opening of the candle, but by the time the candlestick closes, the price managed to rally higher again – leaving a long lower wick behind with either a green or red upper body.
The “body” part of any candlestick simply refers to the difference between the opening and closing price and is either coloured in green or red. It appears green when the closing price was above the opening price and red when the closing price was below the opening price. A valid hammer forex pattern needs to have a lower wick that is at least twice the size of the candle’s body.
What does the hammer forex pattern mean?
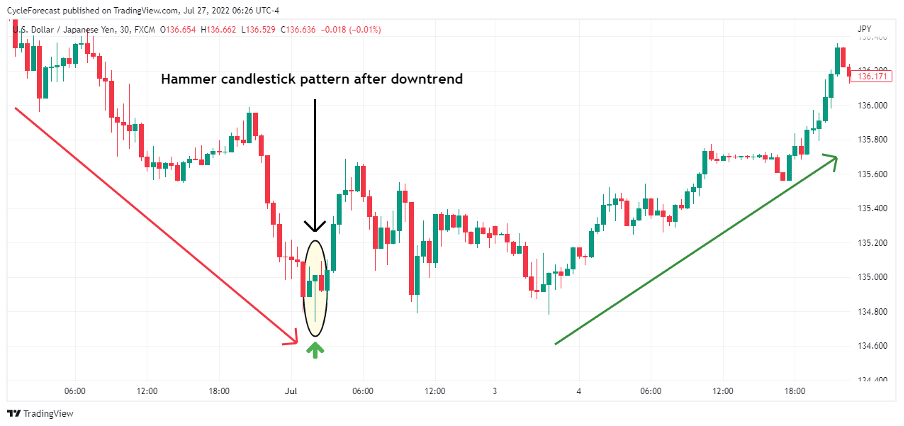
Image for illustration purposes only
Hammer candlestick patterns often appear at the end of a downtrend and tend to forecast a potential reversal. During the formation of the hammer forex pattern, sellers almost immediately drive prices lower after the open, but the selling pressure eventually dries up when an influx of buyers gain the upper hand and drive prices higher again.
On the chart example above, the long lower wick that was left behind was a clear indication that sellers were aggressively pushing this market lower but that they were all flushed out by the buyers in the end.
This price behaviour, as reflected in the hammer shape of the candlestick, signalled a change in investor sentiment, i.e., changing from a bearish to a bullish stance that resulted in a bullish reversal.
How to trade the hammer forex pattern
Although the hammer forex pattern tends to forecast a reversal, there will be times when they do not. When it comes to trading candlestick patterns, experienced traders will often incorporate alternative means of analysis to help them identify the candlestick patterns that might lead to the highest probability reversals.
Next, we will show you a simple strategy that incorporates the Relative Strength Index indicator (RSI). The RSI is a very popular and powerful momentum indicator used by technical analysts to measure the speed and magnitude of a market’s price changes and to determine whether prices are overvalued or undervalued (overbought or oversold).
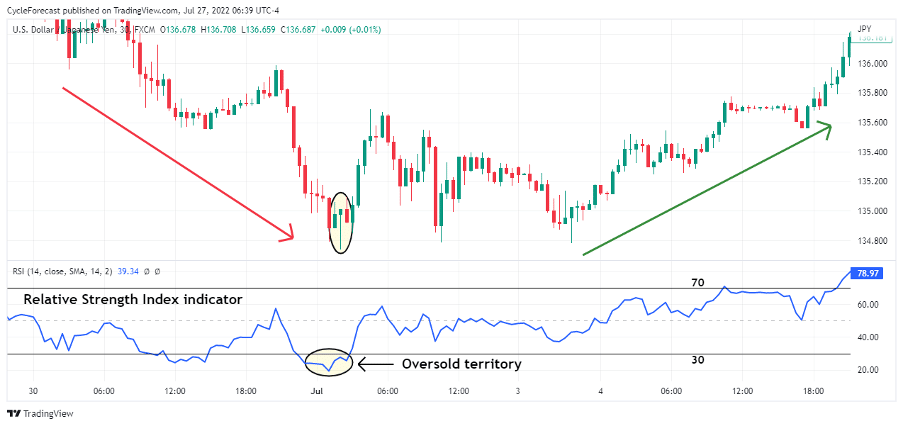
Image for illustration purposes only
The chart image above is the same one we looked at before, but this time, we added the RSI indicator on the lower panel. The blue line on the indicator panel is the RSI line, and the two black horizontal lines are plotted at a value of 30 and 70.
These RSI values run from 0 to 100, and by default, whenever the RSI line crosses below the lower horizontal line at 30, prices are considered oversold or undervalued.
When the RSI closes above the 80 line, then prices are interpreted as overbought or overvalued.
On its own, the RSI has the uncanny ability to warn traders of potential reversals, but when you spot a hammer forex pattern whenever the RSI is in an oversold condition, then the probability of a bullish reversal greatly increases.
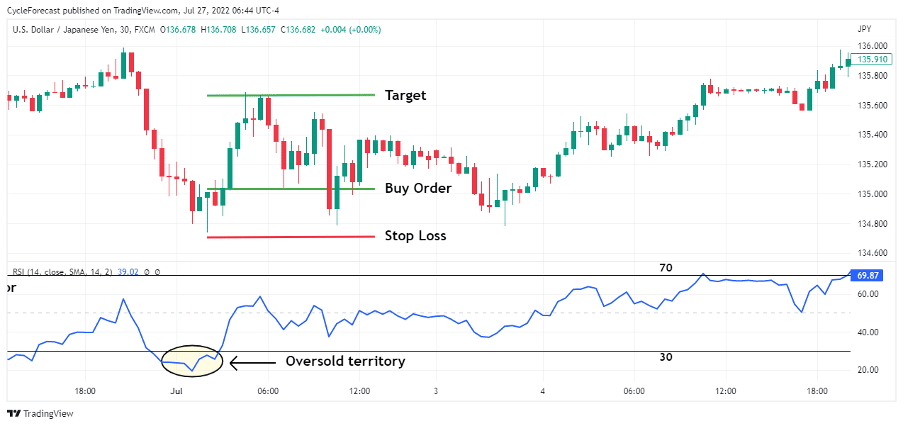
Image for illustration purposes only
Our next chart image shows one way that a trader might decide to enter a long position with this simple strategy. After the RSI went into oversold territory, the appearance of the hammer candlestick signalled that it was time to place a buy order a few pips above the same candle, with a stop-loss a few pips below the candle.
Important note: Hammer patterns need to be confirmed soon after they form. This simply means that you need to see one of the following candlesticks to break above the high of the hammer’s upper range without breaking the low of the hammer’s candle first.
Should the following candlesticks break the low of the hammer candlestick without moving above it first, then the hammer pattern is not confirmed, and you will have to wait for the next one.
The trade entry example above shows that the high of the hammer candlestick was broken by the very next candle, thereby confirming the pattern. This entry technique uses a target set at a range twice the size of the stop-loss level’s range, thereby offering a trader a reward ratio twice the size of the potential risk undertaken in this trade.
Some traders might consider the above entry technique slightly aggressive because there might be times when the RSI remains in an oversold condition for a considerable amount of time before it crosses above the lower horizontal line again.
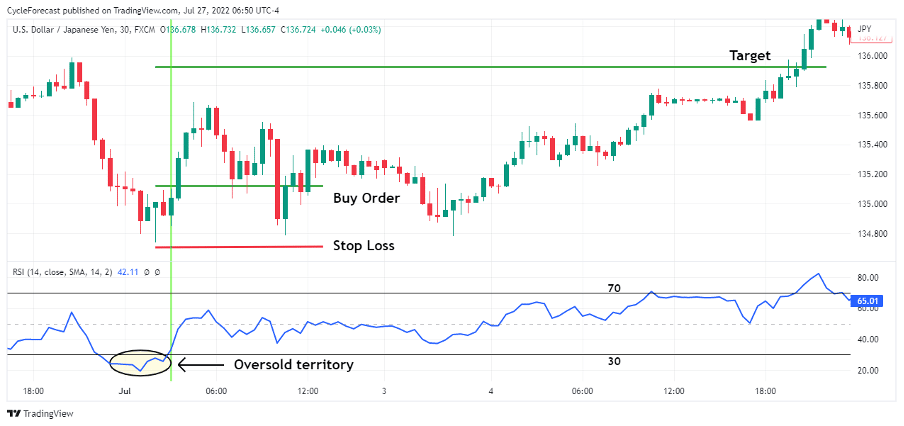
Image for illustration purposes only
Another way to enter a long position relies on the RSI first crossing from an oversold condition back above the lower 30 value line. Some traders will see this as a more conservative approach but an important additional confirmation that prices are indeed getting ready to move higher.
With this entry technique, you still need to see the RSI move into an oversold condition first and wait for the hammer forex pattern to appear, but the actual entry will in most cases be slightly delayed and only happen when the RSI closes above the lower 30 value line (as shown by the green vertical line).
Once the RSI closed above the lower horizontal line, an entry order could have been placed above the candlestick that moved the RSI over the line.
Although the positioning of the entry level using this technique differs from the previous example, the stop-loss level was still placed a few pips below the hammer candlestick’s low and the target level calculated the same way as before.
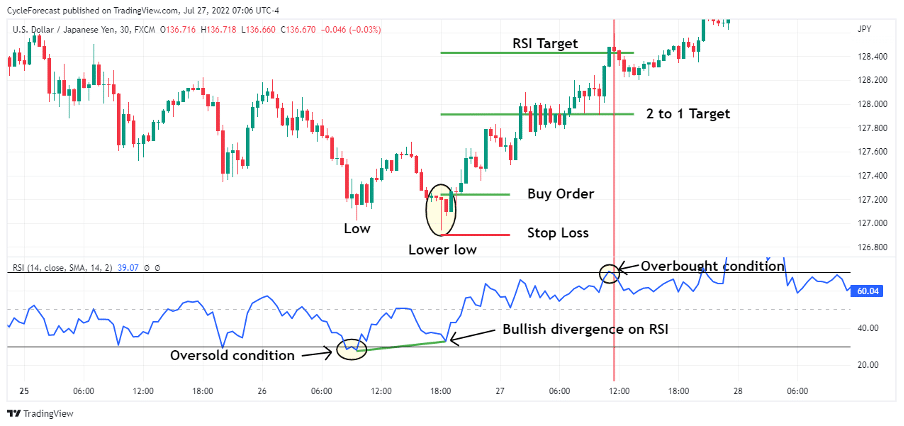
Image for illustration purposes only
Our final entry technique is probably the most powerful one because the resulting trend change often moves fast with a lot of momentum. Similar to the previous two entry techniques, the RSI has to move into an oversold condition first, but rather than a large reversal occurring afterward, the price moves lower again and creates a lower low without the RSI moving into oversold territory again.
This condition is referred to as bullish divergence. It is a strong indication that a trend is running out of momentum and that a reversal is imminent.
With this final entry setup example, a hammer forex pattern formed at the final lower low after bullish divergence on the RSI. This signalled that it was time to place a buy order a few pips above the hammer’s upper range.
Both the stop-loss and target levels were calculated using the same instruction as before, but our final chart image also shows another target higher up.
Traders who wish to place multiple targets or want a way to potentially maximise their profits can also use the RSI as an exit signal.
The red vertical line shows a level where the RSI crossed back below the upper 80 value line for the first time after the entry was taken, and this could have been interpreted as a good time to exit your position. This exit example resulted in a higher return on profit than simply placing a static target as we have shown before.
Conclusion
The hammer forex candlestick pattern often leads to a bullish reversal, but the appearance of this pattern, on its own, does not guarantee a reversal.
There are no definite guarantees when it comes to trading, which is why we introduced the RSI indicator to help you spot the forex hammer candle patterns that may lead to the highest probability reversals.
Candlestick patterns come in many complex or simple forms and can go by many weird and wonderful names. Hopefully, this article will spur you on to explore these fascinating patterns in more detail and help you trade the hammer forex pattern with confidence.
Trade candlestick patterns with top forex brokers
| Broker | Features | Regulator | Platforms | Next Step | |
|---|---|---|---|---|---|
 Your capital is at risk
Founded: 2014 Your capital is at risk
Founded: 2014 |
|
FSPR | MT4 | ||
 Your capital is at risk
Founded: 2006 Your capital is at risk
Founded: 2006Europe* CFDs ar... |
|
ASIC, FSA, FSB, MiFID | MetaTrader4, Sirix, AvaOptions, AvaTrader, Mirror Trader | ||
|
Between 74-89 % of retail investor accounts lose money when trading CFDs |
|
ASIC, FCA | MetaTrader 4, MetaTrader 5, cTrader | ||
|
|
|
ASIC, CySEC, IFSC | MT4 Terminal, MT4 for Mac, Web Trader, iPhone/iPad Trader, Droid Trader, Mobile Trader, MT5 | ||
 Your capital is at risk
Founded: 2006 Your capital is at risk
Founded: 2006 |
|
CySEC, DFSA, FCA, FSB, SIA | MetaTrader4, MetaTrader5, cTrader, FxPro Edge (Beta) | ||
|
|
|
CySEC, FSC, FSCA, MISA | MT4, MT5, OctaTrader | ||

Forextraders' Broker of the Month
BlackBull Markets is a reliable and well-respected trading platform that provides its customers with high-quality access to a wide range of asset groups. The broker is headquartered in New Zealand which explains why it has flown under the radar for a few years but it is a great broker that is now building a global following. The BlackBull Markets site is intuitive and easy to use, making it an ideal choice for beginners.