

A Japanese rice trader named Munehisa Homma developed candlestick charts in the 18th century. He noticed that although there was a correlation between supply and demand and the price of rice, traders’ emotions also had a great influence on markets. Using a variety of colors to visually represent price changes’ magnitude, he used candlesticks to reflect this emotion and investor sentiment.
Today, traders mostly use candlestick charts to make informed trading decisions based on recurring patterns, which tend to forecast a market’s short-term direction.
In this article, we will explore a very popular candlestick pattern: the Harami forex pattern, what seeing this pattern on your chart means, and how to trade it.
What is the Harami Forex Pattern?
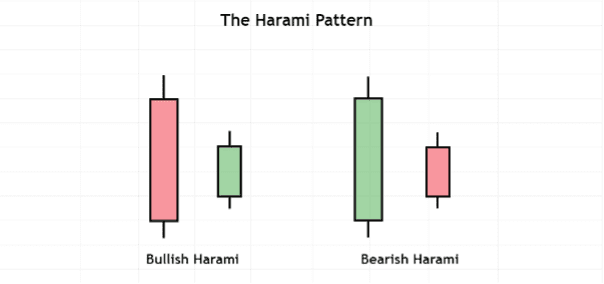
Image for illustrative purposes only
This forex pattern’s name originates from ‘Harami’, the Japanese word for ‘conception’ or ‘pregnant’, because the pattern can be seen to resemble a pregnant woman, with the first large candlestick seen as the ‘mother’ that encompasses or encloses the second smaller candlestick (seen as the ‘baby’).
The Harami candlestick, therefore, comprises two candles that forecast a potential bullish or bearish reversal.
A bullish Harami pattern starts with a red candlestick that forms after a price decline, and has a relatively large red body. The second Harami pattern candlestick directly following it opens at (or higher than) the red candle’s closing price, but by the time this candle closes, it has a small body that is contained within the body of the first.
The complete opposite occurs in a bearish Harami pattern, when the first candle closes higher than its opening price, with a large green body. The second candle in the pattern opens at (or lower than) the first candle’s closing price, and has a red body that is contained within the body of the first. The bearish version of the Harami pattern tends to appear after a period of price rises.
What Does the Harami Forex Pattern Mean?
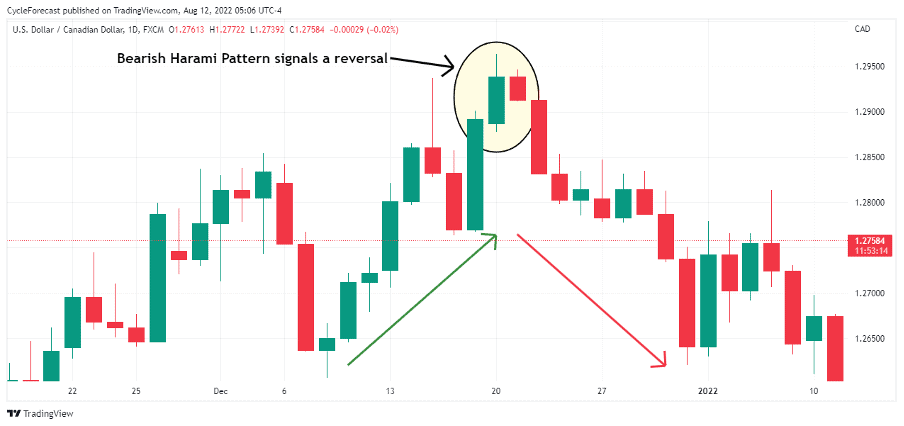
Image for illustrative purposes only
The chart above shows an example of a bearish Harami forex pattern that formed at the peak of a bullish phase before a change in trend followed.
When this pattern appears on a chart, it indicates buyers were still in control during the pattern’s first green candle, when prices closed near the highs. During the formation of the second candlestick, however, buyers failed to push prices to new highs and by the time the second candle closed, sellers were able to drive prices slightly lower.
The fact the second candle failed to make new highs and had a smaller body than the first indicates the bullish momentum leading into the first green candle was decreasing, and a reversal to lower prices may follow.
For a bearish Harami forex pattern to be considered valid (other than by its shape), the next candlestick directly following the pattern formation should break the second smaller candle’s low without achieving new highs above the red or green candlestick.
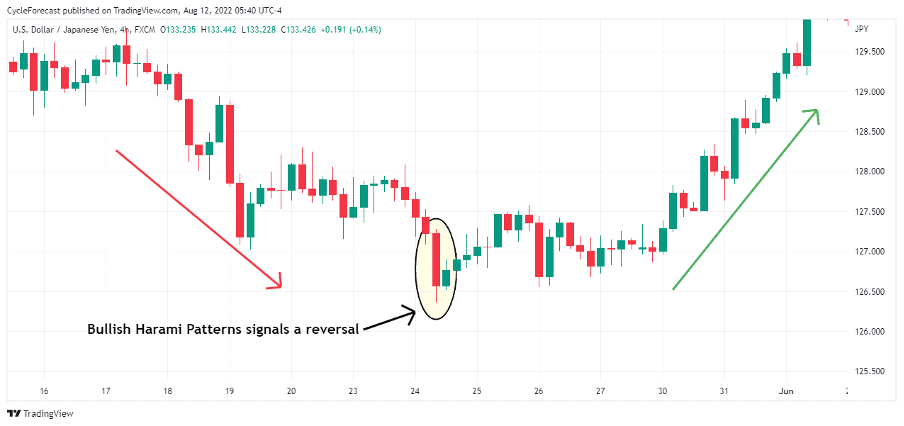
Image for illustrative purposes only
This next chart shows the bullish version of the Harami forex pattern. In this example, the pattern formed right at the end of a bearish trend, before a strong bullish trend reversal.
In this bullish Harami candlestick pattern, the first red candle clearly indicates sellers were still in control of this market, but the second candle failing to make new lows and closing with a small green body indicates the bearish momentum may have started to shift to bull.
How to Trade the Harami Forex Pattern
Here is an easy-to-follow strategy for trading the Harami forex pattern, with an added Moving Average Convergence Divergence (MACD) indicator.
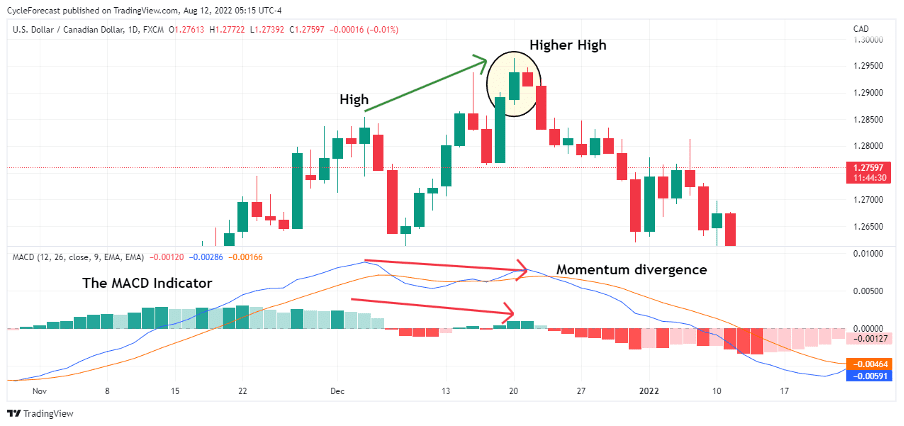
Image for illustrative purposes only
The example above shows the same bearish Harami forex pattern as before, this time with a MACD indicator added to the chart’s lower panel. In this strategy, the MACD indicator is used to identify instances where a bullish or bearish trend’s momentum begins to decline — prior to the formation of a Harami pattern.
Note how momentum — as shown in the MACD indicator — significantly declined, although this market created a higher high. When a market creates a new higher high (or lower low), but the momentum at which the price is moving starts to decrease, we refer to this as momentum divergence, i.e. momentum is moving opposite to a market’s price direction.
Momentum divergence is another indication a trend reversal may be approaching, and in this strategy, it provides additional confirmation the Harami forex pattern may lead to a high-probability trade setup.
Traders will often use additional confirmation methods such as indicators to help them spot forex candlestick patterns that may lead to the highest probability reversals.
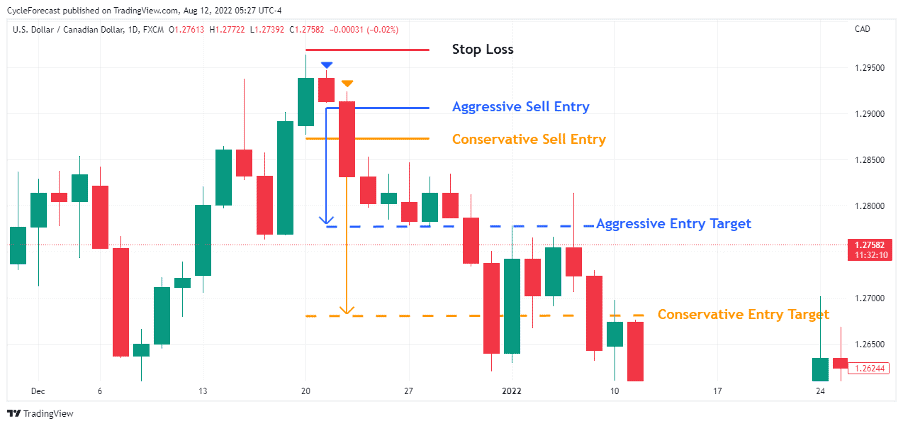
Image for illustrative purposes only
Now that we know what a Harami forex pattern looks like — and how the MACD indicator can be used as additional confirmation — we can proceed to the trade entry and order placement part of the strategy.
There are two ways to enter a short position after a Harami pattern — an aggressive method and a conservative one.
The aggressive method relies on entering a short position as soon as the low of the smaller red candle is broken — as indicated by the blue aggressive sell entry level on the chart above.
The conservative method relies on entering a short position as soon as the first green candlestick’s low is broken to the downside — as indicated by the orange conservative sell entry level on the chart above.
A stop-loss level can be placed above the green candlestick’s high for both entry methods; a target can also be placed on both methods at a level that offers double the reward versus the risk taken.
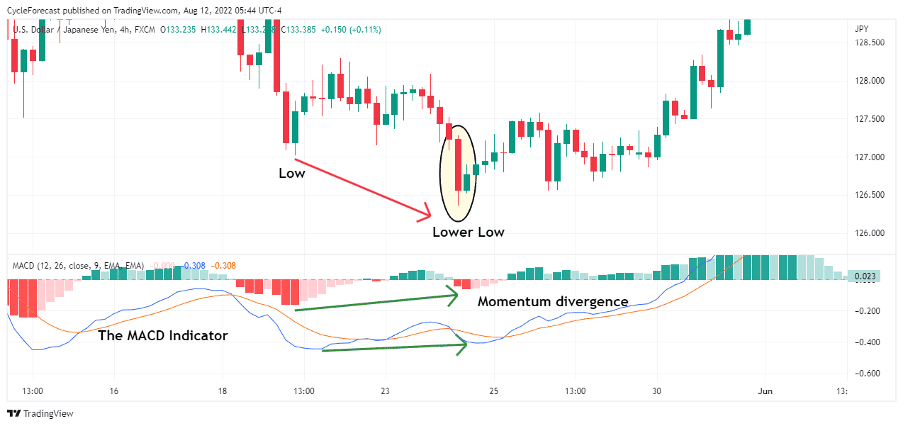
Image for illustrative purposes only
To trade the bullish Harami forex pattern, the MACD indicator must again show momentum divergence as additional confirmation. In the above example, there was clear momentum divergence between a previous market low and a lower low before the bullish Harami pattern formed.
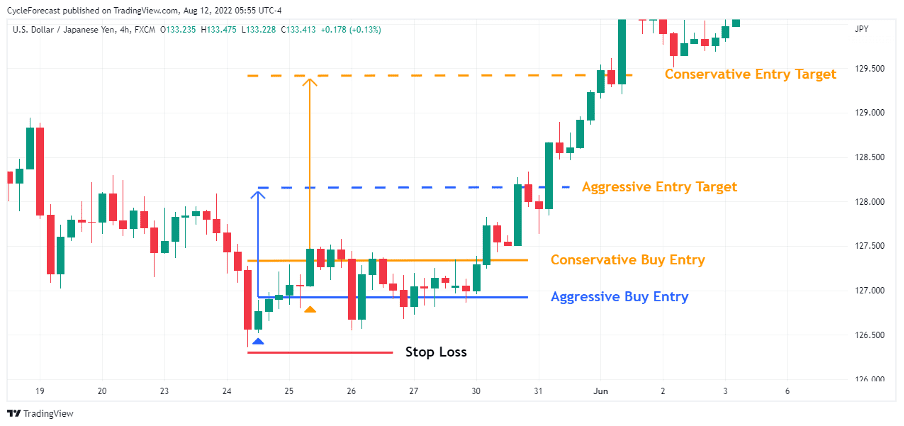
Image for illustrative purposes only
Once the right conditions presented themselves and the Harami forex pattern’s second green candlestick closed, trade orders were placed using the entry methods mentioned above.
Strong reversals followed both the bullish and bearish Harami pattern examples above, reaching trade targets.
Not all Harami forex pattern set-ups will result in profitable trades — that is simply the nature of trading — but when you use additional confirmation methods such as the MACD indicator, you are at least trading set-ups that have the highest probability of being profitable.
Conclusion
The Harami forex pattern often leads to a trend reversal, but traders who follow this pattern generally depend on additional methods to determine whether they should trade the pattern or not.
In the trade examples shown above, we used the MACD indicator to identify instances where a market was losing momentum prior to the formation of a Harami candlestick pattern.
This additional analysis method — in combination with the Harami pattern — will help you spot the highest probability trade set-ups and allow you to trade with confidence.
Trade Candlestick Patterns with Top Forex Brokers
| Broker | Features | Regulator | Platforms | Next Step | |
|---|---|---|---|---|---|
 Your capital is at risk
Founded: 2014 Your capital is at risk
Founded: 2014 |
|
FSPR | MT4 | ||
 Your capital is at risk
Founded: 2006 Your capital is at risk
Founded: 2006Europe* CFDs ar... |
|
ASIC, FSA, FSB, MiFID | MetaTrader4, Sirix, AvaOptions, AvaTrader, Mirror Trader | ||
|
Between 74-89 % of retail investor accounts lose money when trading CFDs |
|
ASIC, FCA | MetaTrader 4, MetaTrader 5, cTrader | ||
|
|
|
ASIC, CySEC, IFSC | MT4 Terminal, MT4 for Mac, Web Trader, iPhone/iPad Trader, Droid Trader, Mobile Trader, MT5 | ||
 Your capital is at risk
Founded: 2006 Your capital is at risk
Founded: 2006 |
|
CySEC, DFSA, FCA, FSB, SIA | MetaTrader4, MetaTrader5, cTrader, FxPro Edge (Beta) | ||
|
|
|
CySEC, FSC, FSCA, MISA | MT4, MT5, OctaTrader | ||

Forextraders' Broker of the Month
BlackBull Markets is a reliable and well-respected trading platform that provides its customers with high-quality access to a wide range of asset groups. The broker is headquartered in New Zealand which explains why it has flown under the radar for a few years but it is a great broker that is now building a global following. The BlackBull Markets site is intuitive and easy to use, making it an ideal choice for beginners.