
Candlestick charts are the most popular charting method among traders, and they can provide insightful information about investor emotion and sentiment. They are also constantly analysed by traders in an effort to identify recurring patterns that can appear in any market and timeframe.
These recurring candlestick patterns often help technical traders to forecast the short-term price direction of a market, depending on the type of candlestick identified and where it forms on a chart.
In this article, we will explore a very popular candlestick pattern – the spinning top forex pattern – what it means when you see this pattern on your chart, and how to trade it.
What Is the Spinning Top Forex Pattern?
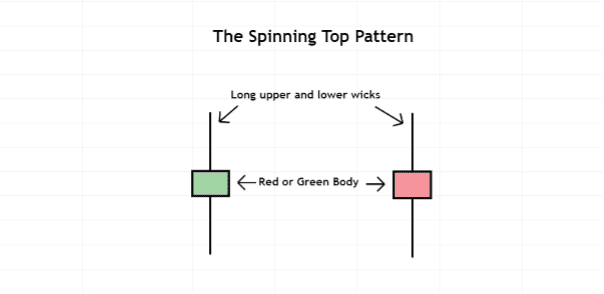
Image for illustration purposes only
The spinning top forex pattern consists of one candlestick that has a small green or red body that is centred between a long upper and lower wick.
The image above illustrates the two variations of the spinning top pattern, and other than the colours of their bodies being different, both patterns represented periods when buyers pushed prices higher, and the sellers pushed prices lower. However, by the time the candles closed, their closing prices were located near their opening prices.
A spinning top forex pattern can appear after a strong bullish or bearish phase and signal a potential price reversal.
Note that when a spinning top pattern forms during a consolidation phase with no clear trend leading up to the appearance of the pattern, it might be an indication that the consolidation phase will continue.
What Does the Spinning Top Forex Pattern Mean?
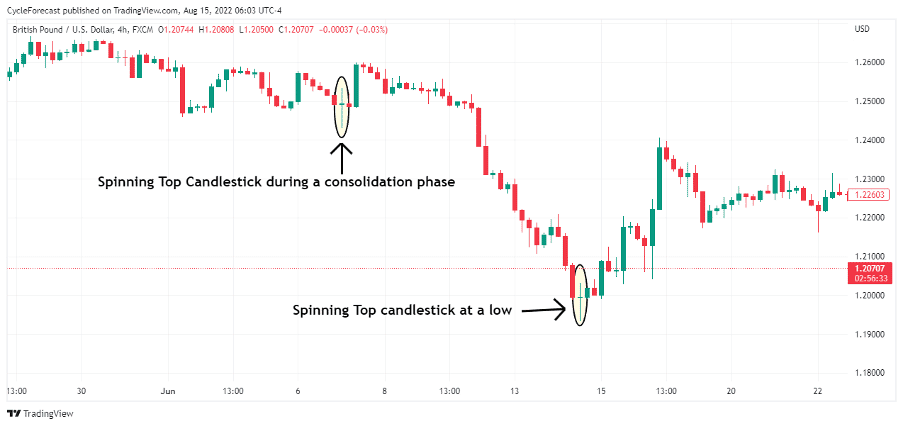
Image for illustration purposes only
From a supply and demand perspective, the spinning top forex pattern represents a period of indecision about the future direction of a market where neither buyers nor sellers could gain the upper hand.
The chart example above shows two instances where the spinning top pattern formed. The spinning top on the left of the chart formed during a consolidation phase, and as noted before, might indicate that the consolidation phase might continue, which is what happened during that time.
The spinning top forex pattern on the right, however, formed after a clear downtrend, which led to a bullish reversal soon afterwards. More significance is therefore placed on spinning tops that form during a strong bullish or bearish trend.
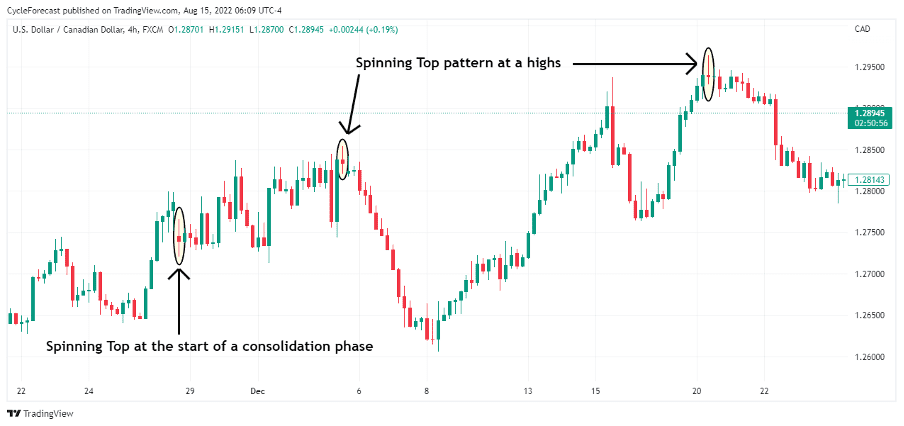
Image for illustration purposes only
Our next chart example shows three instances where the spinning top forex pattern appeared. The spinning top on the far left formed at the start of a consolidation phase and the remaining two spinning tops at highs prior to strong bearish reversals.
It is again important to note that a reversal in price direction is more likely to occur when a spinning top candlestick appears during a clear bullish or bearish trend.
That being said, it is not always that easy to identify the spinning top patterns that are most likely going to lead to a trend reversal, especially when you are trading in real time.
Thankfully, there are two additional methods that we can use to confirm the spinning top patterns that offer the best trading opportunities, which we incorporated in our trading strategy below.
How to Trade the Spinning Top Forex Pattern
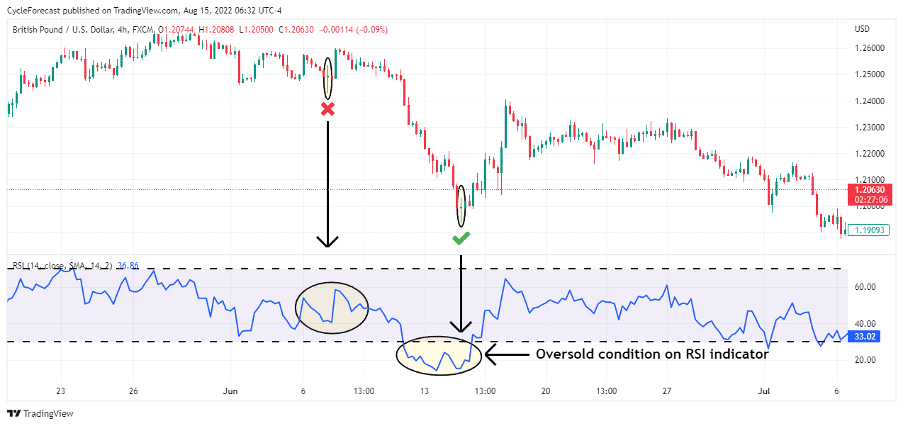
Image for illustration purposes only
The chart example above shows the same spinning top forex patterns as before, but this time we added the relative strength index (RSI) indicator to the lower panel of the chart.
With this strategy, the RSI indicator plays a key role in detecting whether a market is in an oversold or overbought condition. The blue line of the indicator is the RSI line, and the black-dashed horizontal lines represent levels where a market is considered oversold or overbought.
As with the example above, the second spinning top forex pattern (on the right) appeared after a strong decline in price and the RSI indicator entered an oversold condition when the blue RSI line moved below the lower horizontal black line.
The RSI line will generally move above or below the horizontal lines during a strong trending market environment, which makes it easier for us to identify the spinning top patterns that appear during trends and helps us to avoid spinning tops that might form during a period of consolidation.
Note how the blue RSI line was positioned between the upper and lower horizontal lines when the spinning top candlestick on the left appeared. This was a strong indication that this market was in a consolidation phase and not in a trending phase.
The RSI indicator therefore functioned as the first additional confirmation method required to trade this pattern, which will help you trade the highest-probability spinning top setups.
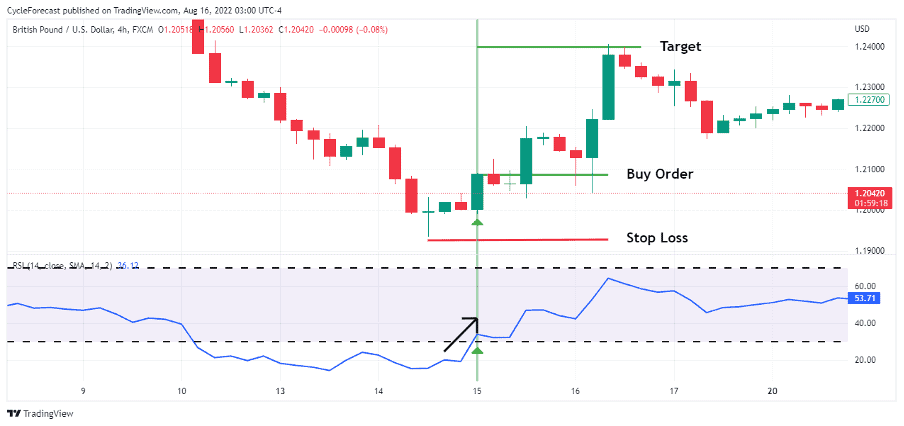
Image for illustration purposes only
The second and final confirmation method (before we discuss the trading part of this strategy) requires that a candlestick that follows the pattern should move above the high of the spinning top, without moving below the spinning top’s low first. This is referred to as the entry confirmation candle.
The green candle marked with the small green arrow on the trade example above shows this additional pattern confirmation, and also note how the RSI moved from an oversold condition back above the lower horizontal line. When this happened, it presented the ideal conditions to enter a long position.
With the RSI crossing above the lower horizontal line and the confirmation candle breaking above the spinning top’s high, a buy order was placed a few pips above the confirmation candle’s high.
A stop-loss order was placed a few pips below the spinning top’s low, and a target was positioned at a level that offered double the reward versus the risk taken during this setup.
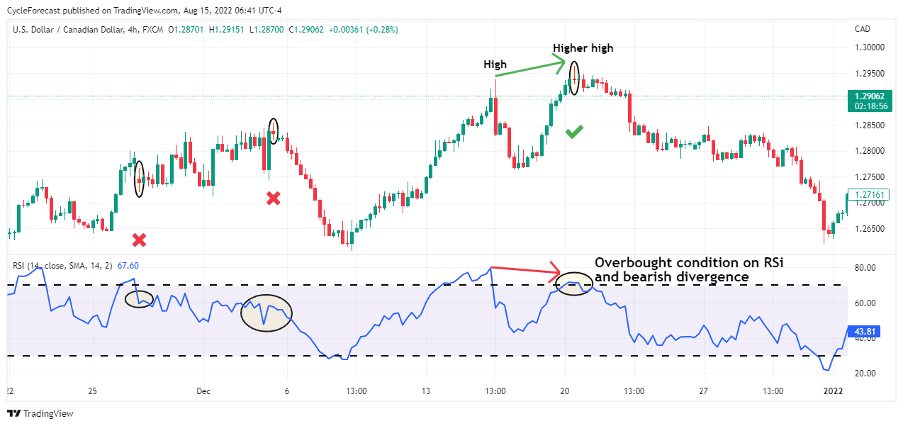
Image for illustration purposes only
Our final two chart images show the same spinning top forex patterns that appeared during a bullish trend. Note how the blue RSI line remained between the upper and lower horizontal lines during the formation of the first two spinning top candles on the left, which, according to our proposed strategy, did not present the ideal trade setups.
The spinning top forex pattern that appeared on the far right of this chart, however, led to the strongest decline after the RSI line went into an overbought condition. Another strong indication that price was likely to decline was when bearish divergence showed up between the previous high and the higher high of this market.
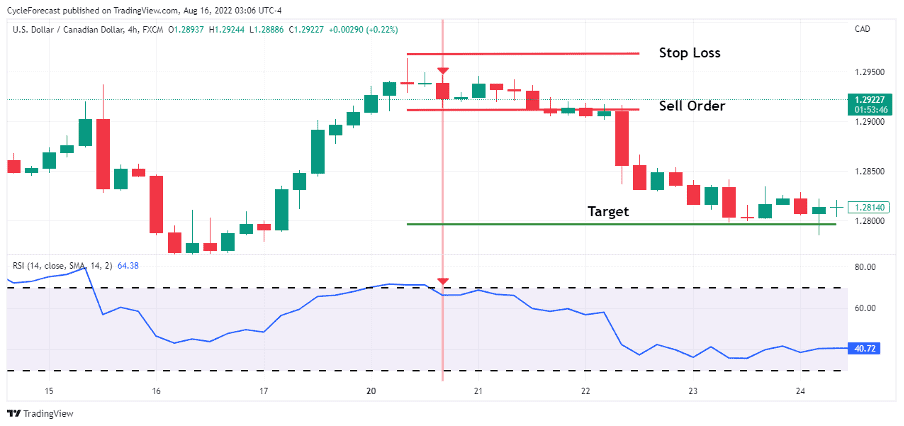
Image for illustration purposes only
The final confirmation part of this strategy appeared when the red candle (marked with the small red arrow) moved below the spinning top’s low, and the blue RSI line crossed back below the upper horizontal line – signalling that it was time to enter a short position.
With this bearish setup example, a sell order was placed a few pips below the red confirmation candle’s low and a stop-loss order was placed a few pips above the spinning top’s high. A target was again placed at a level that offered double the reward versus the risk taken on this trade setup.
Conclusion
The spinning top forex pattern, as we have seen above, is relatively easy to identify, but when it appears on a chart, it might not necessarily mean that a change in trend is definitely going to happen.
As with most candlestick patterns, technical traders will often use additional confirmation methods to help them identify the patterns that may lead to the best trading opportunities.
We relied on the RSI indicator and a confirmation candlestick as our additional methods, which in turn allowed us to identify the spinning top forex patterns that generally lead to strong reversals.
Hopefully, this article helped to shed some light on this popular pattern and offered an easy-to-follow strategy to confidently trade the spinning top forex pattern the next time you spot one on your favourite market.
Trade Candlestick Patterns with Top Forex Brokers
| Broker | Features | Regulator | Platforms | Next Step | |
|---|---|---|---|---|---|
 Your capital is at risk
Founded: 2014 Your capital is at risk
Founded: 2014 |
|
FSPR | MT4 | ||
 Your capital is at risk
Founded: 2006 Your capital is at risk
Founded: 2006Europe* CFDs ar... |
|
ASIC, FSA, FSB, MiFID | MetaTrader4, Sirix, AvaOptions, AvaTrader, Mirror Trader | ||
|
Between 74-89 % of retail investor accounts lose money when trading CFDs |
|
ASIC, FCA | MetaTrader 4, MetaTrader 5, cTrader | ||
|
|
|
ASIC, CySEC, IFSC | MT4 Terminal, MT4 for Mac, Web Trader, iPhone/iPad Trader, Droid Trader, Mobile Trader, MT5 | ||
 Your capital is at risk
Founded: 2006 Your capital is at risk
Founded: 2006 |
|
CySEC, DFSA, FCA, FSB, SIA | MetaTrader4, MetaTrader5, cTrader, FxPro Edge (Beta) | ||
|
|
|
CySEC, FSC, FSCA, MISA | MT4, MT5, OctaTrader | ||

Forextraders' Broker of the Month
BlackBull Markets is a reliable and well-respected trading platform that provides its customers with high-quality access to a wide range of asset groups. The broker is headquartered in New Zealand which explains why it has flown under the radar for a few years but it is a great broker that is now building a global following. The BlackBull Markets site is intuitive and easy to use, making it an ideal choice for beginners.