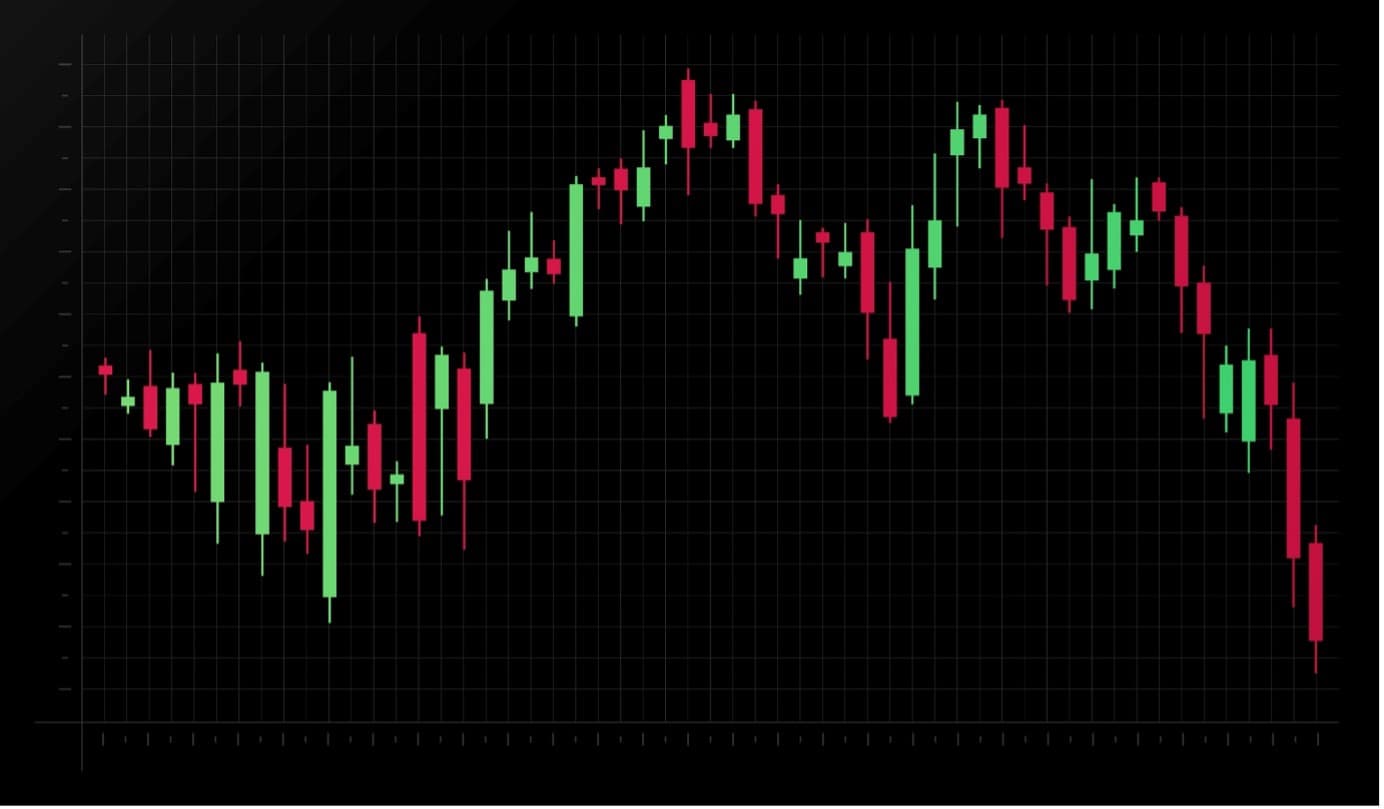

Candlestick charts are the most widely used chart type among traders and they can offer valuable insights into investor sentiment. Traders watch candlesticks closely in an attempt to spot repeatable patterns that occur in any market and timeframe.
Depending on the shape of these candlestick patterns and where they appear on a chart, they often forecast a change in price direction.
In this article, we will explore one such important candlestick pattern – the hanging man forex pattern – what it means when you see it on your chart, and how to trade it.
What Is the Hanging Man Forex Pattern?
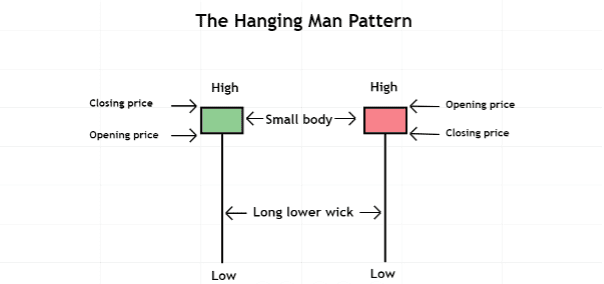
Image for illustration purposes only
The hanging man forex pattern is a singular candlestick pattern like the doji or hammer forex patterns, for example. These patterns have a small body that can be green or red with little to no upper wick.
The lower wick of a forex hanging man pattern, however, is very long and needs to be at least two times greater in size than the body of the candle to be considered a hanging man candlestick.
Note that the shape of the hanging man candlestick can be identical to that of a hammer candlestick pattern, but it is where these candlesticks appear that is important. Hammer candlesticks tend to appear at the end of a downtrend and signal a bullish reversal.
A hanging man candlestick forex pattern, on the other hand, is a bearish reversal pattern that tends to appear after a bullish price advance.
What Does the Hanging Man Forex Pattern Mean?
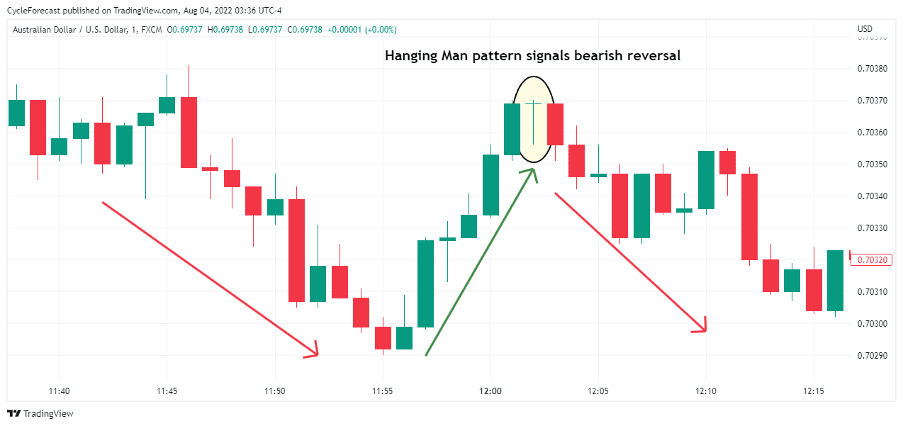
Image for illustration purposes only
The chart example above shows a hanging man candlestick (marked by the oval) that formed right at the end of a bullish price advance before a strong reversal followed. The appearance of this candlestick typically means that selling interest is starting to increase after a period of bullish price action.
As mentioned previously, the hanging man forex pattern is considered a bearish reversal pattern, but another requirement that validates this pattern (other than the shape of the candlestick) is that the candle following the hanging man should show a decline in price.
The red candlestick directly after the appearance of the hanging man therefore acts as an additional confirmation that the pattern is valid and that a potential opportunity to sell a market presented itself.
How to Trade the Hanging Man Forex Pattern
Now that you know what to look out for to validate a hanging man forex pattern, we will next look at a simple strategy to help you trade this popular pattern.
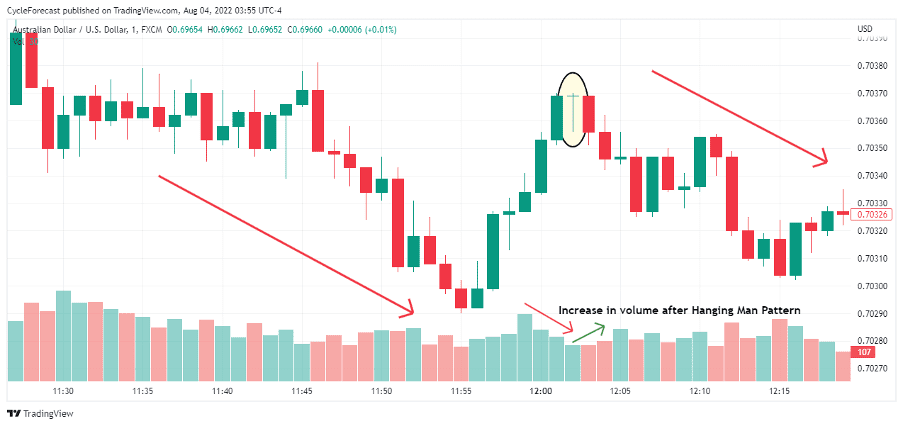
Image for illustration purposes only
Our next chart example shows the same hanging man pattern as before, but this time we added a volume indicator on the lower panel of the chart. Traders who follow this pattern will often rely on additional methods that act as further confirmation that price is indeed getting ready to reverse lower after the hammer candlestick.
With this example, volume first increased as price moved higher but showed a visible decline in volume right before the hanging man forex pattern appeared. This behaviour in volume simply indicated that the buyers were already losing interest as price approached a top.
After the hanging man candlestick, the very next candlestick moved lower, thereby confirming the pattern, but note how the volume started to increase again. Apart from the red candlestick confirming the hanging man pattern, volume confirmed that sellers were starting to outpace the buyers.
Not all hanging man forex patterns lead to reversals, but when a reversal candlestick confirms the pattern with an increase in volume, the probability of a reversal taking place greatly increases.
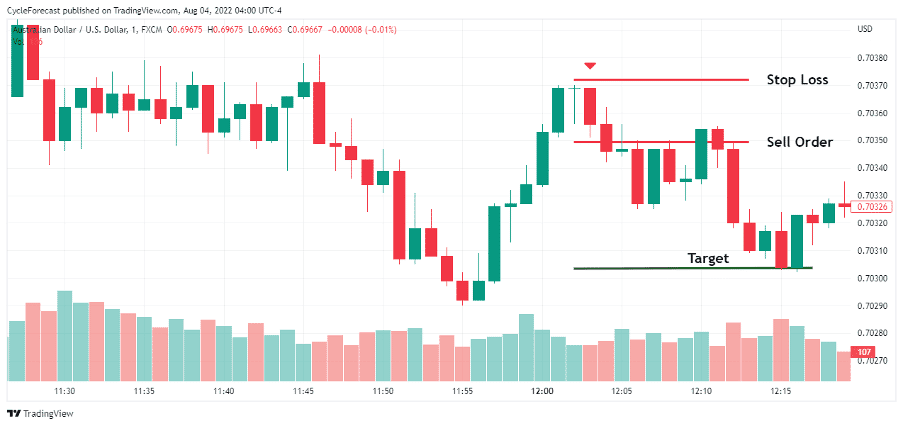
Image for illustration purposes only
Once a hanging man forex pattern has formed and been confirmed soon afterwards, a sell order can be placed a few pips below the red confirmation candlestick (market with red arrow), with a stop loss a few pips above the hanging man candle.
With this easy strategy, a target can be placed at a level that would allow you to profit twice as much than what you are willing to initially risk on any particular trade.
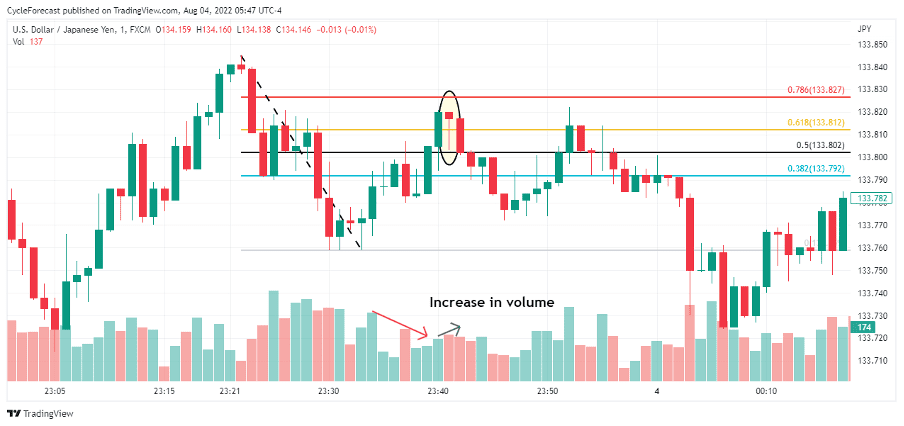
Image for illustration purposes only
Our second entry example shows a ‘picture perfect’ hanging man forex pattern that formed after a correction, but this time with a small red body instead. Note that we also added a Fibonacci retracement indicator to assist with identifying potential resistance levels.
During corrective phases, a market will typically find support or resistance at major Fibonacci retracement levels. This was the case with our example above when a hanging man forex pattern appeared soon after price reached the 61.8% Fibonacci ratio.
Here also, the candlestick directly after the hanging man candle reversed lower with an increase in volume, signalling that all the right conditions were present to attempt a trade.
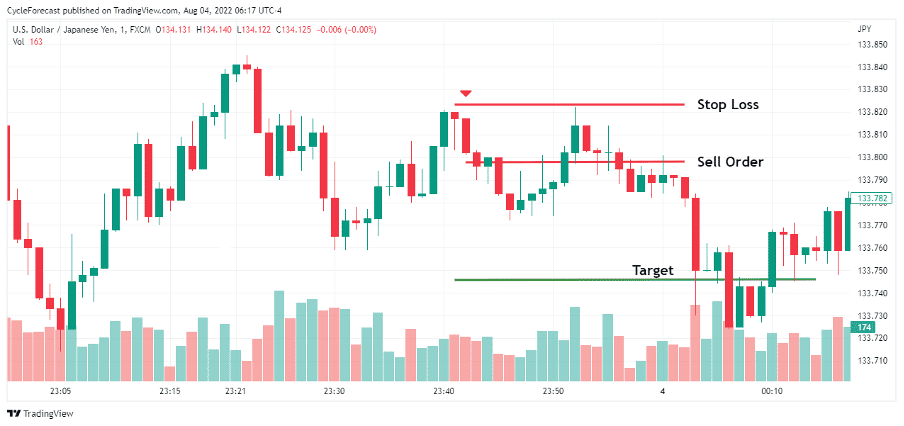
Image for illustration purposes only
Following the same entry procedure as before, a sell order could have been placed a few pips below the red confirmation reversal candlestick (marked with red arrow), and a stop loss a few pips above the hanging man candle.
In this final example, a target was again placed at a level that offered double the reward versus the initial risk.
Conclusion
The hanging man candlestick forex pattern is a popular pattern that signals a bearish reversal. However, as discussed above, there are a few additional confirmation signals that need to validate this pattern – you should not rely on the shape of the candlestick alone.
Using additional indicators such as volume and Fibonacci ratios can greatly help with identifying the hanging man patterns that often lead to the highest-probability reversals.
Hopefully, this article helped to shed some light on this fascinating pattern and offered an easy-to-follow strategy to trade the hanging man candlestick pattern the next time you spot one on your favourite market.
Trade Candlestick Patterns with Top Forex Brokers
| Broker | Features | Regulator | Platforms | Next Step | |
|---|---|---|---|---|---|
 Your capital is at risk
Founded: 2014 Your capital is at risk
Founded: 2014 |
|
FSPR | MT4 | ||
 Your capital is at risk
Founded: 2006 Your capital is at risk
Founded: 2006Europe* CFDs ar... |
|
ASIC, FSA, FSB, MiFID | MetaTrader4, Sirix, AvaOptions, AvaTrader, Mirror Trader | ||
|
Between 74-89 % of retail investor accounts lose money when trading CFDs |
|
ASIC, FCA | MetaTrader 4, MetaTrader 5, cTrader | ||
|
|
|
ASIC, CySEC, IFSC | MT4 Terminal, MT4 for Mac, Web Trader, iPhone/iPad Trader, Droid Trader, Mobile Trader, MT5 | ||
 Your capital is at risk
Founded: 2006 Your capital is at risk
Founded: 2006 |
|
CySEC, DFSA, FCA, FSB, SIA | MetaTrader4, MetaTrader5, cTrader, FxPro Edge (Beta) | ||
|
|
|
CySEC, FSC, FSCA, MISA | MT4, MT5, OctaTrader | ||

Forextraders' Broker of the Month
BlackBull Markets is a reliable and well-respected trading platform that provides its customers with high-quality access to a wide range of asset groups. The broker is headquartered in New Zealand which explains why it has flown under the radar for a few years but it is a great broker that is now building a global following. The BlackBull Markets site is intuitive and easy to use, making it an ideal choice for beginners.