
Over a century before the West created the bar and point-and-figure charts, candlestick charts were invented by a Japanese man named Munehisa Honma in the 1700s. He noticed that although there was a correlation between price and the supply and demand of rice, traders’ emotions also had a significant impact on the markets.
Candlesticks reflect this emotion and investor sentiment by using various colours to graphically represent the magnitude of price changes. Traders mainly use candlestick charts to help them make trading decisions based on recurring patterns that aid in predicting the short-term direction of a market.
In this article, we will explore a very popular candlestick pattern – the engulfing forex pattern – what it means when you see it on your chart, and how to trade it.
What Is the Engulfing Forex Pattern?
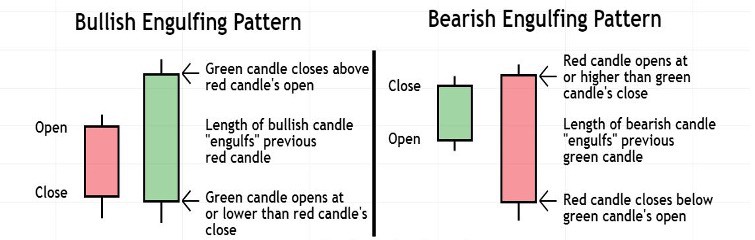
Image for illustration purposes only
The engulfing candle forex pattern consists of two candlesticks and can be classified as either a bullish or bearish engulfing pattern depending on where it appears on a chart.
The bullish engulfing pattern’s first candlestick shows a decline in price with a closing price that is lower than the opening price. Directly after the first candlestick, the second candlestick opens at or lower than the red candle’s closing price. Soon afterwards, price starts to move higher, and by the time this candlestick closes, it has a much larger body than the preceding red candle. The green candle also closes above the red candle’s open, and traders refer to the second candle as ‘engulfing’ the first candle.
The bearish engulfing pattern’s first candlestick shows an increase in price with a closing price that is higher than the opening price. After the first candle, the second candlestick opens at or higher than the green candle’s closing price. Soon afterwards, price starts to move lower, and by the time this candlestick closes, it has a much larger body than the preceding green candle. The red candle also closes below the green candle’s open, and therefore also ‘engulfs’ the first candle.
The bullish engulfing pattern tends to appear after a period when a market was declining and signals a potential bullish reversal. The bearish engulfing pattern, on the other hand, generally appears after a period when a market was moving higher and forecasts a potential bearish reversal.
What Does the Engulfing Forex Pattern Mean?
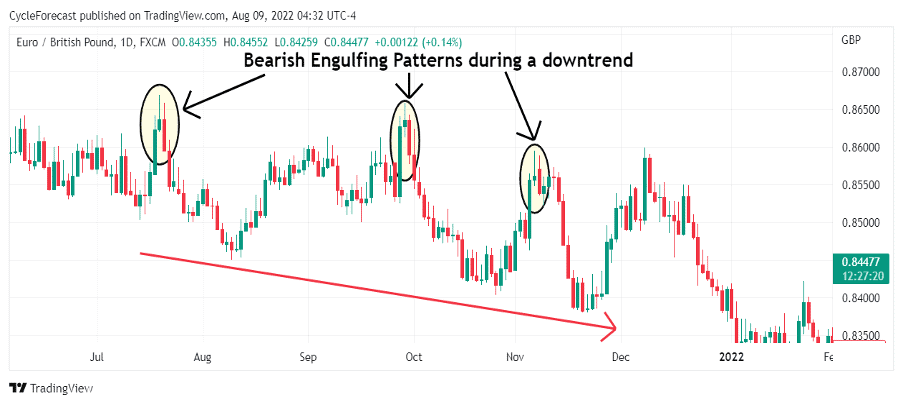
Image for illustration purposes only
The chart example above shows three instances where a bearish engulfing forex pattern (marked by the yellow ovals) formed during a downtrend.
When this pattern appears on a chart, it indicates that the sellers have overtaken the buyers and that they are more aggressively pushing prices lower than the buyers were able to push prices higher during the preceding green candle.
All three bearish engulfing forex patterns formed right at the end of counter-trend corrections, which led to a resumption of the downtrend afterward. The same pattern can, however, also form at the highs of uptrends before a bearish reversal follows, and not only after counter-trend corrections.
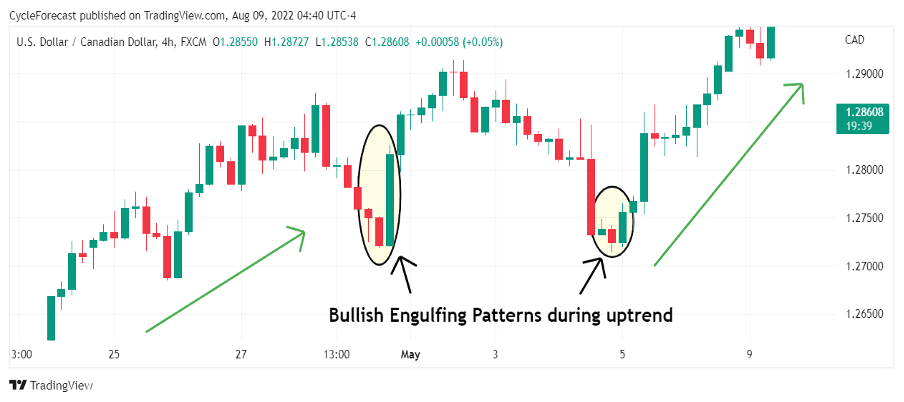
Image for illustration purposes only
Our next chart example shows two instances where a bullish engulfing forex pattern appeared during an established uptrend, which, at the time, indicated that the selling pressure had dried up and that buyers were aggressively entering this market.
How to Trade the Engulfing Forex Pattern
Next, we will discuss a simple strategy to help you trade the engulfing forex pattern with the addition of a volume indicator to identify the highest-probability reversals.
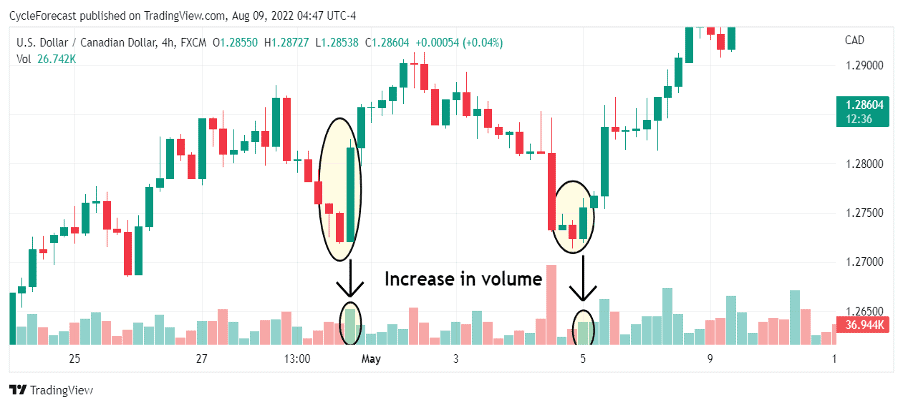
Image for illustration purposes only
The chart example above shows the same bullish engulfing forex pattern as before, but this time we added a volume indicator to the lower panel of the chart. With this strategy, the volume indicator plays an important role in detecting whether the engulfing candlestick (the green candlestick in this example) showed an increase in buying volume (green volume bars marked with yellow ovals).
Note how volume picked up during the formation of the second green engulfing candlestick. This was a clear additional indication that the buyers have overtaken the sellers and that a high-probability bullish reversal was imminent.
Traders will often use additional confirmation methods, such as indicators, to help them spot the forex engulfing candle patterns that may lead to highest-probability reversals.
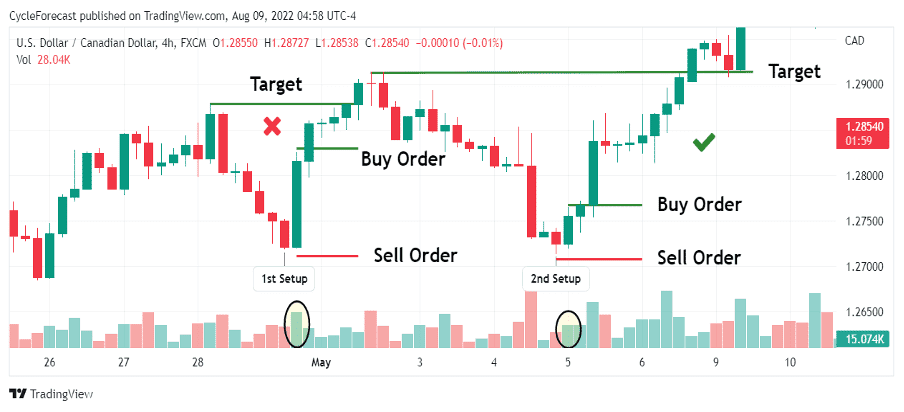
Image for illustration purposes only
Now that we know what an engulfing forex pattern looks like and how the volume indicator can be used as additional confirmation, we can proceed to the trade entry and order placement part of this strategy.
Once the pattern has been confirmed, a buy order can be placed a few pips above the green engulfing candle’s high. A stop-loss order can be placed a few pips below the lowest point of the pattern and a target order at a level where a previous high formed (opposite for a bearish setup).
The entry order placements on the examples above show that although there were two valid bullish engulfing pattern setups, only the second setup offered a better reward potential.
Take the first setup, for example – the green engulfing candle validated the pattern with a visible increase in volume, but if you placed a buy order above that candle, then the distance to the target level versus the distance to the stop-loss level was too small. This means that you would have risked more on this trade setup than the potential reward.
The second entry opportunity also had all the valid characteristics of a bullish engulfing forex pattern, but with this setup, there was far more reward potential than the risk taken, resulting in a much more favourable risk-reward ratio.
Note that the trade examples above have shown setups that occurred after counter-trend corrections with targets placed at previous highs. If a bullish or bearish engulfing forex pattern were to appear at the potential end of a trend instead, then you might want to consider aiming for a target that offers double or more the reward than what you are willing to risk.
Conclusion
The engulfing forex pattern warns of a potential price reversal, and depending on the combination of the two-candle pattern and where it tends to appear on a chart, a trader can determine the likely direction that price might follow afterwards and use this knowledge to their advantage.
With the trade examples shown above, we used the volume indicator to help us identify the engulfing forex patterns that generally lead to the highest-probability reversals, but incorporating other indicators, such as the MACD, may also work.
Hopefully, this article helped shed some light on this popular and powerful reversal pattern and offered an easy-to-follow strategy to trade the engulfing forex pattern the next time you spot one on your favourite market.
Trade Candlestick Patterns with Top Forex Brokers
| Broker | Features | Regulator | Platforms | Next Step | |
|---|---|---|---|---|---|
 Your capital is at risk
Founded: 2014 Your capital is at risk
Founded: 2014 |
|
FSPR | MT4 | ||
 Your capital is at risk
Founded: 2006 Your capital is at risk
Founded: 2006Europe* CFDs ar... |
|
ASIC, FSA, FSB, MiFID | MetaTrader4, Sirix, AvaOptions, AvaTrader, Mirror Trader | ||
|
Between 74-89 % of retail investor accounts lose money when trading CFDs |
|
ASIC, FCA | MetaTrader 4, MetaTrader 5, cTrader | ||
|
|
|
ASIC, CySEC, IFSC | MT4 Terminal, MT4 for Mac, Web Trader, iPhone/iPad Trader, Droid Trader, Mobile Trader, MT5 | ||
 Your capital is at risk
Founded: 2006 Your capital is at risk
Founded: 2006 |
|
CySEC, DFSA, FCA, FSB, SIA | MetaTrader4, MetaTrader5, cTrader, FxPro Edge (Beta) | ||
|
|
|
CySEC, FSC, FSCA, MISA | MT4, MT5, OctaTrader | ||

Forextraders' Broker of the Month
BlackBull Markets is a reliable and well-respected trading platform that provides its customers with high-quality access to a wide range of asset groups. The broker is headquartered in New Zealand which explains why it has flown under the radar for a few years but it is a great broker that is now building a global following. The BlackBull Markets site is intuitive and easy to use, making it an ideal choice for beginners.