
Technical analysis, or TA for short, is a trader’s best friend when it comes to finding the best opportunities for trading in the volatile forex market, but the subject matter is vast. Where do you start on your TA journey as a beginner? Indicators and pattern recognition are two key areas worthy of early study, including a foray into the realm of Candlestick patterns. One of the many interesting trading techniques showcased in this arena is known as the Tweezer Top pattern.
Japanese traders have used candlesticks in commodity trading since the 1600s, but it took another 300 years before these techniques were explained to a Western audience. The Tweezer Top forex pattern is just one example that has been studied and utilised by veteran traders over the last 30 years. In this article, you will learn about candlesticks, the Tweezer Top pattern, what it means when you see it and how to incorporate it into your daily trading regimen.
What is the Tweezer Top Candlestick Forex Pattern?
Candlesticks are now common on our charts. They are a clever way to present open, close, high and low-price points for a specific trading timeframe. The ‘body’ is typically a box enclosing the opening and closing values, while ‘wicks’ or ‘shadows’ extend from either side of the body to reflect the high and low value for the period. These charts use the colour convention of showing a gain as a green body and a fall in prices as a red body. The various shapes for a given period or series of periods proffer a measure of investor sentiment.
The definitive sourcebook for studying candlestick patterns is Japanese Candlestick Charting Techniques, authored by Steve Nison and published in 1991. Traders adept in the art of interpreting candlestick signals can often spot highly probable reversals or trading setups where trend continuations are highly likely. As with all technical indicators, however, these formations are not perfect, but they do offer a way to get the needed edge in a market to be successful.
What is the forex Tweezer Top candlestick formation? Courtesy of eToro, review this chart:
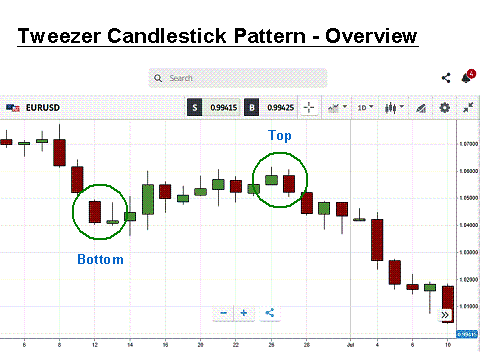
Source: MetaTrader
A daily EUR/USD chart with annotations is presented. To begin with, the use of the word ‘Top’ is a bit of a misnomer. Tweezers can be both a Top and a Bottom, and, as with tweezers having two blades, a Candlestick Tweezer also appears as a pair of candlesticks side by side. A ‘Top’ refers to the occurrence of two candles with two high points of roughly the same value. For a ‘Bottom’, the opposite is true, signifying a possible bottom reversal, as opposed to a top reversal.
After a bit of study, you will discover that candlesticks come in a variety of shapes. One or both of the candles in a Top or Bottom Tweezer can also be one of these shapes, which will provide additional information on the trend at hand, whether it might be a continuation or an imminent reversal. Another benefit is that the Tweezer wicks give you an optimum positioning for a stop-loss order, since their presence quickly becomes a support or resistance level.
The following graphic presents a basic understanding of several common and popular candlestick patterns. Note that signals originate from either a single or series of successive patterns and have stylish names, while the green/red arrows denote the trend changes that followed each grouping:
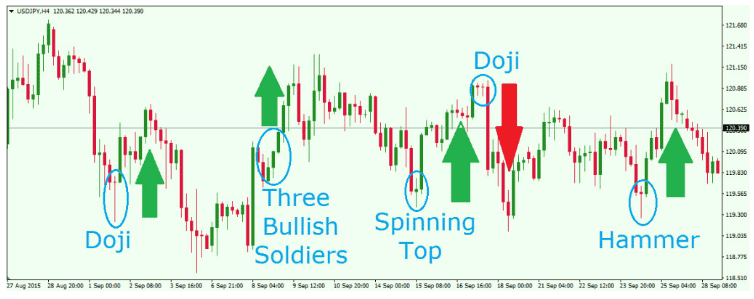
Source: LinkedIn
A trader need not be aware of every candlestick shape in existence, but an understanding of the basic patterns can be extremely helpful when trying to interpret the meaning behind a Tweezer formation. These technical signals are a guide for developing a trading strategy, but combining additional indicators to complement and confirm the suggestions observed can always enhance the effectiveness of these little shapes.
What does the Tweezer Top Candlestick Pattern Mean?
There is a basic logic behind why the Tweezer pattern is a good indication of an imminent change in pricing direction, but not all Tweezers are the same. The lengths of the two wicks/shadows are important, as are the directional colours of the two opposing candlesticks. Ideally, the wicks will be rather longish by nature, a sign of strength, and the body of the second candlestick will represent a strong reversal in immediate pricing behaviour.
In our overview example above, the initial Bottom pattern has rather short down wicks. A reflection of the weakness of this signal is that the succeeding candle actually has a lower low than the preceding Tweezer. The Top pattern that follows, on the other hand, displays slightly larger wicks, along with a demonstrably larger down body, per the red candle in the chart. In this case, the signal is highly representative of a good trading setup, and we will revisit this example in the trading discussion that follows.
From an investor sentiment perspective, the Tweezer pattern is telegraphing a distinct change in investor support in the case of a Top, and the opposite is true when a Tweezer Bottom is encountered. In other words, momentum is ebbing. This shift could be the sign that a strong trend is ending, or it could also highlight a brief period of profit taking and the further continuation of the trend at hand. Please be aware that trading is risky and can result in significant losses.
Interpretation of the Tweezer pattern can also be enhanced when the shapes take on the dimensions of other common candlestick patterns. The Top in our overview example is a good illustration of this premise. The second red candle is also known as a ‘Bearish Engulfing Pattern’. Its body fully engulfs the preceding green body, thereby signifying a pullback before a sharper downward trend. It usually makes an appearance at the end of an upward trend, but its reliability is hampered in ranging markets. Combined with a Tweezer, it is more effective.
In some cases, the literature on Tweezer formations actually describes a more limited explanation for this particular shape. A few authors only speak to a Tweezer Top or Bottom as those situations where two or more candles have matching tops or bottoms without wicks or shadows. As noted above, the absence of wicks would suggest a very weak reversal or continuation signal, which could be enhanced greatly
if one of the candles resembled another important shape. For example, an ‘engulfing’ pattern, when it is the last in the series, would strengthen the signal considerably.
Tweezer patterns appear in financial markets, including the forex market, quite often. It is common for investors to have a second thought about future pricing directions, but with the assistance of other candlestick shapes and technical indicators, the voracity of Tweezer signals can be greatly enhanced. No technical system of alerts will ever be correct for every situation, but with further confirmation from other sources, a trader can get the edge he needs to succeed.
How do you trade the Tweezer Top Candlestick Forex Pattern?
Tweezer Tops forex patterns offer excellent setup opportunities, especially when an additional technical indicator is used for confirmation of the validity and quality of the signal observed. Let’s delve a bit deeper into our overview chart to gain Tweezer trading insights for future use.
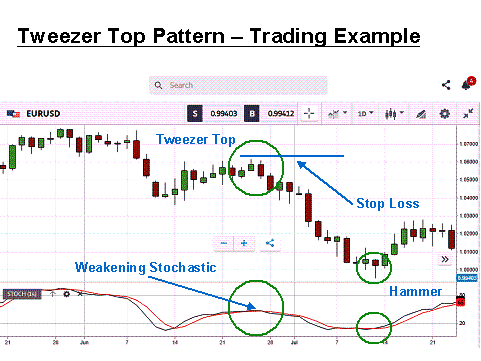
Source: MetaTrader
We have broadened the overview chart to include more time periods, and our focus will now be on the Tweezer Top formation occurring in the middle of the EUR/USD daily chart, courtesy of eToro. The two upper wicks for the candles forming the Tweezer are similar in size, although not exactly the same. The first body is green, followed by an opposing red one, which is also an ‘engulfing’ pattern. The signal is for a pullback, a possible sign of profit taking, as investors have sold the euro short in the process and a portion of them wish to cash in their profits. Please be aware that trading is risky and can result in significant losses.
We have added the Stochastics indicator at the bottom of the chart, and it is sending a similar signal of waning momentum. It had risen from its oversold territory, but the two lines refused to cross past the middle range of the scale, a sure sign of weakness in the price move. Odds favour a continuation of the previous downward trend. Sell the euro short with a stop-loss order inserted at the top of the two opposing wicks of the Tweezer.
Do you see the ‘hammer’ on the right of the chart in the green circle above the Stochastic indicator? It is another reversal signal, courtesy of Japanese Candlestick trading techniques, and, when combined with the Stochastic reversal, it represents a good time to close our position. In this case, this trade would have yielded a gain of roughly 500 pips, but keep in mind that the Tweezer is capable of giving false signals as well.
Conclusion
Tweezer Top and Bottom pattern recognition can be a formidable addition to any trader’s technical toolbox, along with a healthy understanding of complementary candlestick formations. The strong point of this pattern is its ability to forecast a pullback in market action. In order to gauge the strength of the pullback and whether it might be a reversal or a continuation of an existing trend, it is important to combine its guidance with that of another indicator system.
Practice time on a free demo system is an excellent way to get familiar with the various aspects of the Tweezer and to gain confidence in its use. Learn to insert stop-loss orders as the Tweezer suggests and try out a few other indicators to act as signal confirmation tools. Using the Tweezer in real-time will soon demonstrate its benefits and incorporating it into your daily trading regimen will be easy and straightforward.
Trade Tweezer Candlestick Top Patterns with Top Forex Brokers
| Broker | Features | Regulator | Platforms | Next Step | |
|---|---|---|---|---|---|
 Your capital is at risk
Founded: 2014 Your capital is at risk
Founded: 2014 |
|
FSPR | MT4 | ||
 Your capital is at risk
Founded: 2006 Your capital is at risk
Founded: 2006Europe* CFDs ar... |
|
ASIC, FSA, FSB, MiFID | MetaTrader4, Sirix, AvaOptions, AvaTrader, Mirror Trader | ||
|
Between 74-89 % of retail investor accounts lose money when trading CFDs |
|
ASIC, FCA | MetaTrader 4, MetaTrader 5, cTrader | ||
|
|
|
ASIC, CySEC, IFSC | MT4 Terminal, MT4 for Mac, Web Trader, iPhone/iPad Trader, Droid Trader, Mobile Trader, MT5 | ||
 Your capital is at risk
Founded: 2006 Your capital is at risk
Founded: 2006 |
|
CySEC, DFSA, FCA, FSB, SIA | MetaTrader4, MetaTrader5, cTrader, FxPro Edge (Beta) | ||
|
|
|
CySEC, FSC, FSCA, MISA | MT4, MT5, OctaTrader | ||

Forextraders' Broker of the Month
BlackBull Markets is a reliable and well-respected trading platform that provides its customers with high-quality access to a wide range of asset groups. The broker is headquartered in New Zealand which explains why it has flown under the radar for a few years but it is a great broker that is now building a global following. The BlackBull Markets site is intuitive and easy to use, making it an ideal choice for beginners.