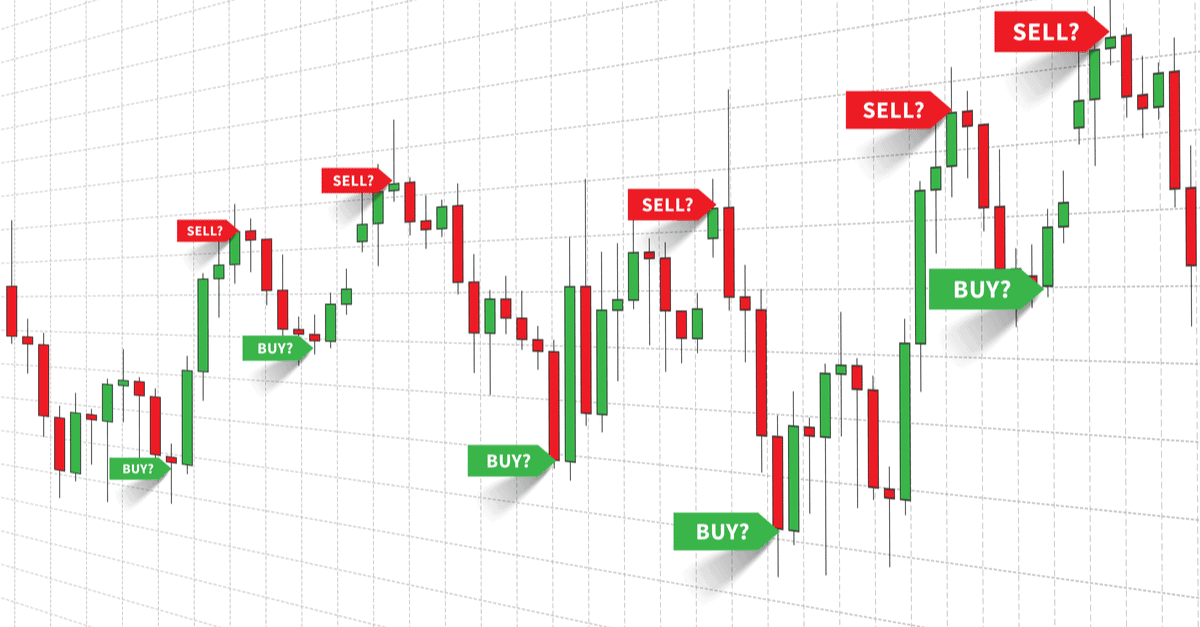

Since the 17th century, the Japanese have traded commodities using candlestick charts, but it was not until the 1990s that this type of charting method was introduced to the Western world by a man named Steve Nison.
Today, candlestick charts are still widely used by technical analysts because the information they display are visually more appealing than line charts or bar charts, for example.
Just like technical chart patterns repeat in all markets and timeframes, candlesticks also repeat certain patterns that tend to forecast specific price behaviour.
In this article, we are going to take an in-depth look at a very popular and common pattern – the tweezer bottom forex pattern – what it means when this pattern shows up on your chart, and how to trade it.
What Is the Tweezer Bottom Forex Pattern?
Source: Tradingview.com
Image for illustration purposes only
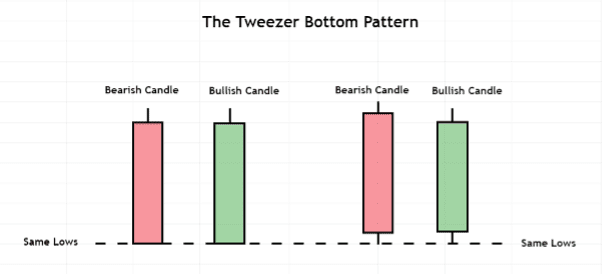
The tweezer bottom forex pattern consists of two candlesticks, the first one being bearish and the second one being bullish.
There can be a few variations to the tweezer bottom pattern, as shown by the illustration above, but the main characteristic shared between all variations is that both candles have the same or similar lows.
As with many other popular candlestick patterns, the forex tweezer bottom pattern occurs rather frequently. The term ‘bottom’, used to describe this pattern, refers to where this pattern generally appears, which is at the end (bottom) of bearish trends or corrections within a bullish trend.
The tweezer pattern is therefore considered a bottoming pattern, which forecasts a potential bullish reversal.
What Does the Tweezer Bottom Forex Pattern Mean?
Source: Tradingview.com
Image for illustration purposes only
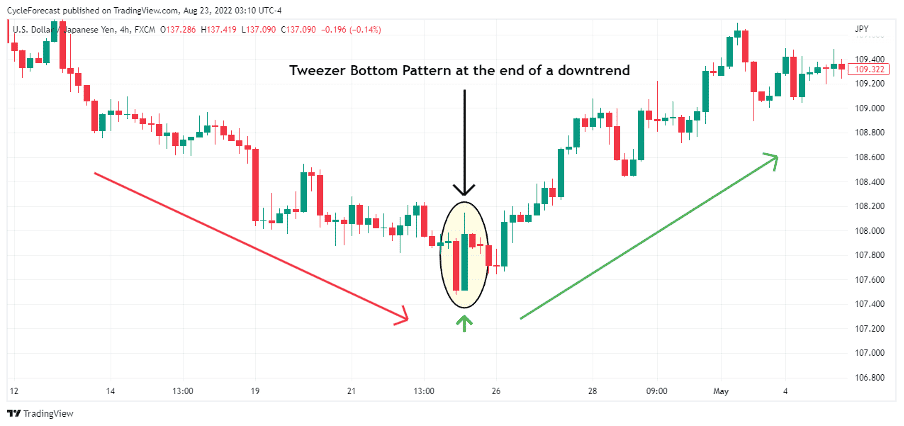
The chart example above shows a tweezer bottom forex pattern that formed right at the bottom of a bearish trend before a strong bullish reversal followed.
This pattern started off with a large red bearish candlestick, which was indicative that sellers were in clear control during this period, especially when the red candle closed near its lows.
Soon after the close of the red candle, price almost immediately found support at the starting time of the next candle and moved higher.
This price behaviour during the formation of the tweezer bottom forex pattern warned that there was a potential shift in momentum from sellers to buyers and that a bullish reversal was likely to follow.
The fact that both of the tweezer bottom candlesticks had similar lows was also a sign that price had potentially reached a strong support level.
Source: Tradingview.com
Image for illustration purposes only
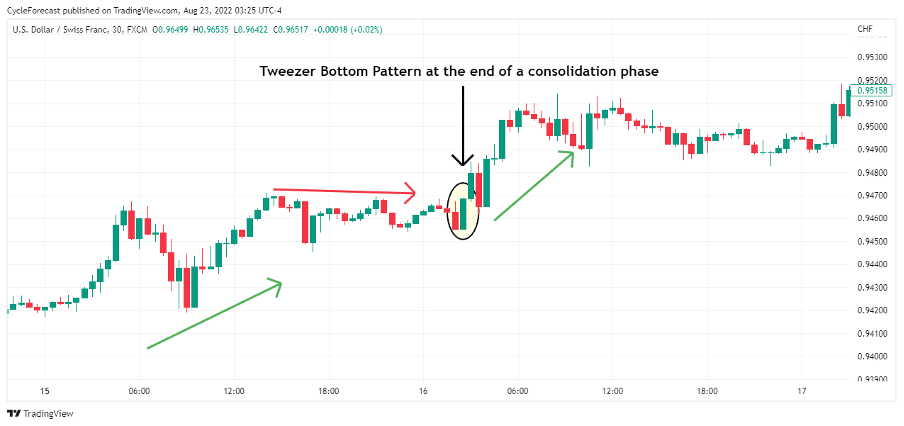
Our next chart image shows a tweezer bottom forex pattern that formed at the end of a consolidation phase before the previous bullish trend resumed. Here also, both the candlesticks of the pattern had similar lows, and by the time the green candlestick closed, it indicated that the prior bullish trend was ready to continue.
How to Trade the Tweezer Bottom Forex Pattern
Although the tweezer bottom forex pattern appears often and tends to forecast a bullish reversal, there will be times when a change in trend does not occur. This is why traders will often include additional technical confirmation methods, such as indicators, to identify the candlestick patterns that might lead to the highest-probability setups.
Next, we will discuss an easy-to-follow trading strategy that relies on the popular moving average convergence divergence (MACD) indicator, which will function as an additional confirmation method before trading the tweezer bottom forex pattern.
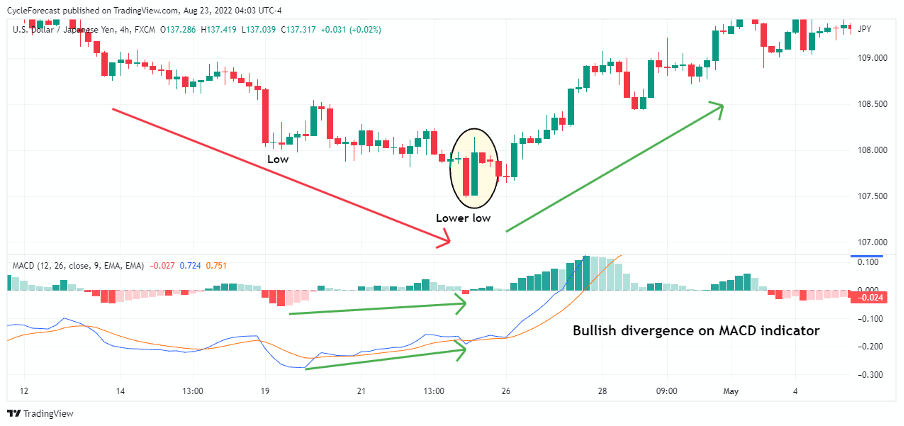
Source: Tradingview.com
Image for illustration purposes only
The chart image above shows the same tweezer bottom forex pattern example that we presented before, but this time we added the MACD indicator to the lower panel of the chart.
In short, the MACD indicator is a trend-following momentum indicator that traders use to spot instances where a trend is losing momentum. Trends generally start off with a lot of momentum, but then lose momentum before they end and reverse direction.
With this strategy, we want to see momentum declining prior to the formation of the tweezer bottom forex pattern before we proceed to the trade entry part.
Note how the red bars of the MACD indicator (known as a histogram) were bigger at the start of that downtrend than at the end of the trend. This was a clear indication that the downtrend was losing momentum and additional confirmation that a bullish reversal might occur at any time.
When a trend makes lower lows (or higher highs), but momentum starts moving in the opposite direction, this is referred to as momentum divergence. With the example above, bullish divergence on the MACD indicator was a leading indication that a change in trend was imminent.
Source: Tradingview.com
Image for illustration purposes only
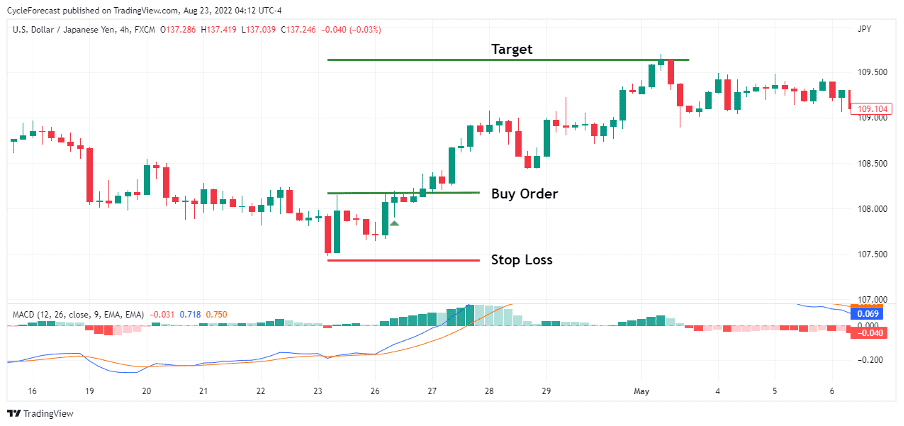
As soon as the MACD indicator confirmed a loss of momentum and the tweezer bottom forex pattern has formed, we can proceed to the final part of the strategy, which will discuss the entry, stop loss, and target order placement.
As the tweezer bottom pattern signals a potential bullish reversal, a trader can then place a buy order a few pips above the green candle of the pattern and a stop-loss order below the lowest point of the pattern to limit their risk.
With the trade example above, there was a period when five candles formed before price moved above the high of the pattern’s green candle and the buy order was executed (indicated by the small green arrow).
It is important to note that price also confirmed that it was ready to move higher, but if a situation arises where your buy order does not get triggered, and the lowest point of the pattern gets broken instead, then it would invalidate the pattern and it would be best to cancel your trade orders.
Source: Tradingview.com
Image for illustration purposes only
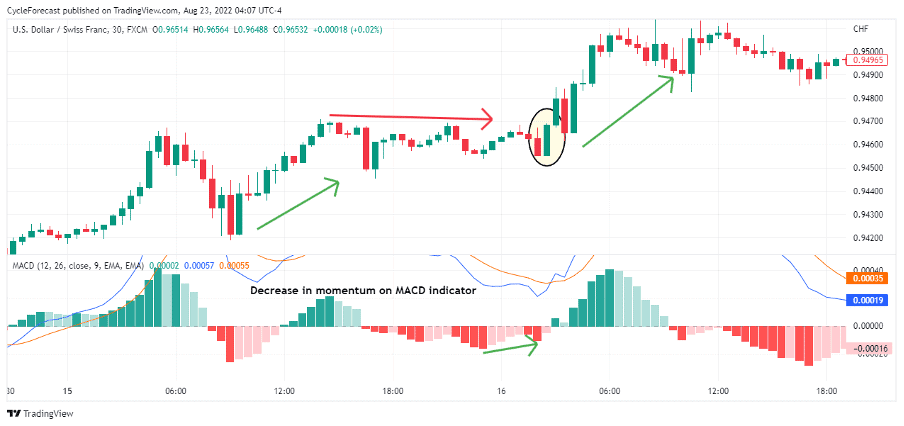
Our final trade example shows the same tweezer bottom forex pattern that formed during a consolidation phase. Here also, momentum decreased leading up to the tweezer bottom pattern, and as soon as the second green candle of the pattern completed, the previous bullish trend resumed.
Source: Tradingview.com
Image for illustration purposes only
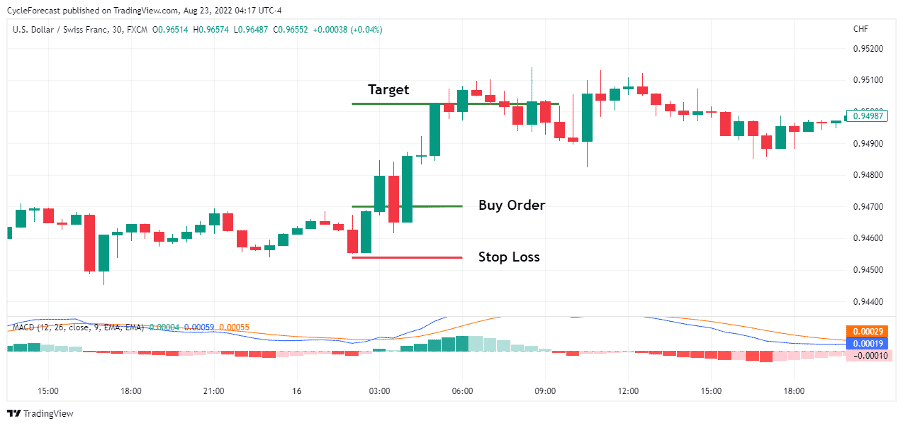
Following the same trade order instructions as before, a buy order was positioned a few pips above the green candle of the forex bottom pattern and a stop-loss order a few pips below the lows of the pattern.
With this trade setup, the very next candle triggered the buy order and the previous bullish trend resumed. A target was again placed at a level that offered double the reward versus the risk taken on this trade.
Conclusion
The tweezer bottom forex pattern appears regularly in any market and timeframe, but as we discussed before, it is often best to include additional means of analysis to identify the tweezer bottom patterns that may lead to the highest-probability setups.
Although we used the MACD indicator as part of our proposed strategy, other technical tools may also be used to identify the best tweezer bottom pattern setups.
Hopefully, this article will spur you on to explore more of these fascinating candlestick patterns and help you trade the tweezer bottom forex pattern with confidence.
Trade Candlestick Patterns with Top Forex Brokers
| Broker | Features | Regulator | Platforms | Next Step | |
|---|---|---|---|---|---|
 Your capital is at risk
Founded: 2014 Your capital is at risk
Founded: 2014 |
|
FSPR | MT4 | ||
 Your capital is at risk
Founded: 2006 Your capital is at risk
Founded: 2006Europe* CFDs ar... |
|
ASIC, FSA, FSB, MiFID | MetaTrader4, Sirix, AvaOptions, AvaTrader, Mirror Trader | ||
|
Between 74-89 % of retail investor accounts lose money when trading CFDs |
|
ASIC, FCA | MetaTrader 4, MetaTrader 5, cTrader | ||
|
|
|
ASIC, CySEC, IFSC | MT4 Terminal, MT4 for Mac, Web Trader, iPhone/iPad Trader, Droid Trader, Mobile Trader, MT5 | ||
 Your capital is at risk
Founded: 2006 Your capital is at risk
Founded: 2006 |
|
CySEC, DFSA, FCA, FSB, SIA | MetaTrader4, MetaTrader5, cTrader, FxPro Edge (Beta) | ||
|
|
|
CySEC, FSC, FSCA, MISA | MT4, MT5, OctaTrader | ||

Forextraders' Broker of the Month
BlackBull Markets is a reliable and well-respected trading platform that provides its customers with high-quality access to a wide range of asset groups. The broker is headquartered in New Zealand which explains why it has flown under the radar for a few years but it is a great broker that is now building a global following. The BlackBull Markets site is intuitive and easy to use, making it an ideal choice for beginners.