Experienced forex traders learn early on that the forex market is fickle and that one size does not fit all market conditions when it comes to various trading strategies. Hedge funds and major banking institutions are known to release a host of algo-trading bots at the beginning of a market session, review early results to see which ones are performing well, and then turn off the losers. What does a retail forex trader do to adapt strategies on the fly? One approach is to concentrate on candlestick patterns, and the pin bar pattern is just one powerful tool.
What is the pin bar candlestick pattern? We will discuss this topic in more detail later, but for now, let’s look at the graphic below:
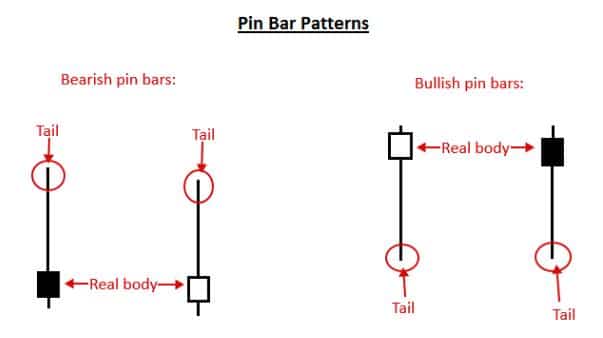
As you can see, there are both bearish and bullish pin bar patterns, and in this case, a pin bar formation is a single candlestick, not a series of two, three or more candles. It is a relatively strong signal of an imminent reversal of a trend or the continuation of a trend after a brief pullback. This candle shape is not rare, so caution is always advised. It can provide a false-positive signal, but the use of other technical tools can confirm the high-probability version.
Martin J. Pring, often called the ‘technician’s technician’ by Barron’s, is given credit for discussing this pattern at length and giving it its distinctive name. He has also formed several advisory and investment firms during his career, primarily in the US. A native of the UK, he has authored more than 15 books covering investment and trading topics, but he is best known for his classic Technical Analysis Explained, which is required reading for most industry certifications.
Pring originally named this candlestick the ‘Pinocchio bar’, but this term was soon shortened to pin bar. The candle has a smallish body with little to no tail or wick on one end. The longish wick on the other end of the shape suggests that the market has misled investors by overreacting, or it has colloquially ‘lied’ to investors, thereby creating a long ‘nose’ reminiscent of the Pinocchio character.
Pin bars come in a variety of shapes, and traders would be wise to understand each form and in which markets reliability can be highest for each one. Generally speaking, pin bars are strongest after either a strong up or downtrend. In fact, a pin bar can often punctuate the turning point of a major trendline as latecomers to the rally display exuberance when support is actually waning. False positives most often occur during ranging periods, when indecision is afoot, and the market has not made up its mind about its future direction.
Have you seen this candlestick pattern in action? In the article that follows, we will provide the necessary information for knowing how to spot this candle, what it means regarding market psychology, and how to use it in your daily trading routine. At the end of this discussion, we will also provide you with a list of the very best brokers in the forex industry.
What Is the Pin Bar Candlestick Forex Pattern?
The best way to introduce you to a pin bar is by way of a real-time example:
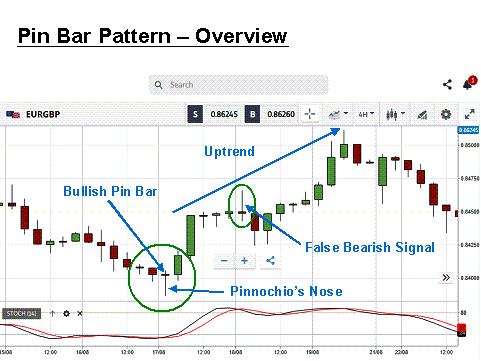
This four-hour chart of the EUR/GBP currency pair is courtesy of eToro. We have added the necessary annotations to explain the finer points of this candlestick. The large green circle encircles a bullish pin bar, while the smaller green oval overlays a bearish pin bar, which also happens to be a false-positive alert. Western analysts knew of the importance of pin bars even when bar charts were the norm, but the advent of candlesticks expanded upon this theme.
Traditional candlestick methodology refers to a bullish pin bar as a hammer, and the bearish version as a shooting star, but in each case, the bodies of the candles tend to be larger with no wick on one end. The key to finding a pin bar is that a small wick is permissible on one end, but the opposite wick must be at least two times the size of the body. A larger multiple suggests a stronger formation with higher reliability. A smaller multiple suggests a weaker formation.
It can also be said that not all pin bars are created equal. Colour, size multiple and location do make a difference. It is preferable that the bullish pin bar be a green colour, while a red bearish form connotes a more reliable candle. A ‘perfect’ pin bar candle would also have a ‘5X+’ multiple of the wick to body size, and a trader should typically avoid pin bars that occur within a consolidation or ranging market. Reliability is enhanced when all three of these rules apply.
What Does the Pin Bar Candlestick Pattern Mean?
It is important for all traders to realise that both veteran and professional traders immediately recognise significant candlestick patterns the moment they are formed. The beauty of them is that they instantly recap for the chosen time period exactly what transpired in the ongoing battle between buyers and sellers. The size of the body, the length of the accompanying wicks, and the all-important colour, which proclaims the winner for the period, reveal the nature of the fight.
What does the pin bar candlestick pattern tell us about market psychology? Let’s return to the first green circle in the above overview chart. This pin bar followed a strong downward trend, and the presence of a long tail below the body tells us that the market rejected any attempt by overly exuberant sellers to move the price lower. The length of the tail speaks to the strength of the rejection. In this case, the wick is more than five times the size of the body. Even though the body is small, it is green, which tells us that the buyers won those four hours.
As all three rules have been met for a ‘perfect’ pin bar setup, it is not a surprise to see the next two very strong candles, perhaps, a little too strong, as the market quickly levelled out. The green oval on the chart notes a bearish pin bar, but should we expect a dramatic downturn of events? Not necessarily, as the candle appeared during a sideways movement in prices. It merely indicates uncertainty, as weak hands cash in their gains, and smarter ones hold on.
How to Trade the Pin Bar Candlestick Forex Pattern
How should we trade the perfect pin bar pattern on this chart? Here is the same chart with a few more notations for clarification:
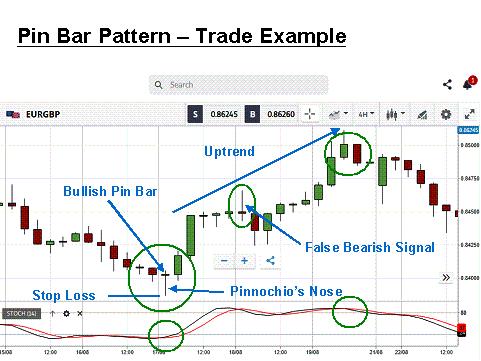
We have included the stochastics oscillator because it is known to provide reliable signals during a strong trend in the forex market. With all three rules being met in the first green circle and with confirmation from the stochastics, the correct move would be to open a long position for the euro at the next period’s opening. The literature also suggests a positioning of a stop loss just below Pinocchio’s nose for risk management purposes.
When should the position be closed? The pin bar candlestick, which signalled the potential for a strong reversal, attracted the attention of a multitude of traders, who wanted to jump up on the uptrend to come, and an assortment of other traders, who held short positions and who wished to avoid a squeeze. The abrupt rise and levelling out were to be expected. A conservative trader might want to exit at this point, but the strength of the pin bar would tell a more aggressive trader to move the stop loss up and wait for a continuation.
The trend did continue on its rise, but at its zenith, a less-than-perfect shooting star forms, along with a less-than-perfect engulfing pattern. The presence of these two candles side by side and the stochastics’ downward movement suggest that a sale is in order. This trading sequence would have netted a gain of nearly 100 pips. A pullback is a common occurrence when you have a strong pin bar. It is expected and should be welcomed. Being patient is the lesson.
Conclusion
Pin bar patterns are common in the forex arena, yet they are a powerful messenger of a potential reversal or continuation. Even though this formation is only a single candlestick, it is worthy of your attention when trading in trending markets. There are varying degrees of this formation, but when all criteria related to colour, size and location are met, it is time to react quickly. You can be sure that other traders will try to jump on this bandwagon. Take the time on your demo system to get acquainted with the nuances of pin bars and get ready to take advantage in real time.
Trade Candlestick Patterns with Top Forex Brokers
| Broker | Features | Regulator | Platforms | Next Step | |
|---|---|---|---|---|---|
 Your capital is at risk
Founded: 2014 Your capital is at risk
Founded: 2014 |
|
FSPR | MT4 | ||
 Your capital is at risk
Founded: 2006 Your capital is at risk
Founded: 2006Europe* CFDs ar... |
|
ASIC, FSA, FSB, MiFID | MetaTrader4, Sirix, AvaOptions, AvaTrader, Mirror Trader | ||
|
Between 74-89 % of retail investor accounts lose money when trading CFDs |
|
ASIC, FCA | MetaTrader 4, MetaTrader 5, cTrader | ||
|
|
|
ASIC, CySEC, IFSC | MT4 Terminal, MT4 for Mac, Web Trader, iPhone/iPad Trader, Droid Trader, Mobile Trader, MT5 | ||
 Your capital is at risk
Founded: 2006 Your capital is at risk
Founded: 2006 |
|
CySEC, DFSA, FCA, FSB, SIA | MetaTrader4, MetaTrader5, cTrader, FxPro Edge (Beta) | ||
|
|
|
CySEC, FSC, FSCA, MISA | MT4, MT5, OctaTrader | ||

Forextraders' Broker of the Month
BlackBull Markets is a reliable and well-respected trading platform that provides its customers with high-quality access to a wide range of asset groups. The broker is headquartered in New Zealand which explains why it has flown under the radar for a few years but it is a great broker that is now building a global following. The BlackBull Markets site is intuitive and easy to use, making it an ideal choice for beginners.