
One important rule of forex trading is that a trader must always approach the market with a disciplined plan of attack, preferably a trading strategy that helps to identify opportunities and then leads you step by step through the process of opening a position, managing risk, and then closing the position for a gain. There are many strategies that have stood the test of time, and one of these is the ‘bullish piercing line pattern’.
Many of these time-tested trading strategies are based on candlestick pattern recognition, and the piercing line patterns, both bullish and bearish, are just two of these candle-enabled approaches. It is worth learning the insights that these unique little shapes can provide if only to be aware of what other experienced traders are discerning and how they might react.
For now, let’s focus on the bullish version of the piercing line pattern:
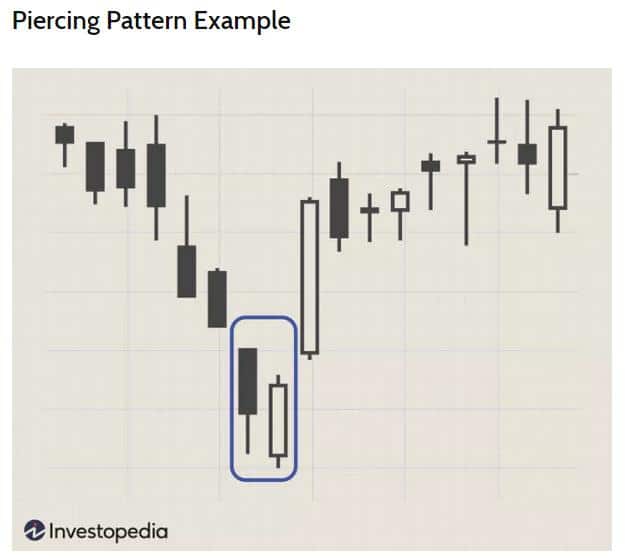
Graphic courtesy of Investopedia.com
The bullish piercing line pattern consists of two candles, which may appear at the end of a downtrend or after a brief pullback. It signifies the potential for a reversal. The first candle must have a long red body, but the second candle, more so with stocks than forex, must ‘gap’ at its open below the body of its companion. It must also be a green candle that closes above the 50% line of the previous red body and then closes within it. Observe the two candles above.
Pricing gaps are rare in the forex arena as volumes are so high and liquidity is so deep. This fluidity of the foreign exchange market is the cause of its continuity of price flows, but occasional gaps can and do appear. Those appearances, however, typically occur during major economic announcements or after special events, when pricing is erratic and chaotic. At these times, brokers tend to halt trading or ignore stop-loss orders per their agreement with you. In other words, it is not a welcoming or healthy time to be trading forex pairs.
The bullish piercing line pattern does occur more often than you might think, but if you make one small accommodation when trading forex, then you can take advantage of the reversal signal that it provides. The second candle’s opening price may still be the closing price of the previous red candle, but for visual purposes, imagine the body of the green candle to include the lower wick.
A ‘gap’ will now appear, and if it closes above the 50% line of and within the body of the red candle, then you have a worthy trading setup opportunity. Rare candle patterns such as the bullish kicking pattern can be very reliable when telegraphing continuation or reversal signals. The bullish piercing line pattern falls within the moderately reliable category as it is not as rare. For this reason, many consider this pattern an alert, and they will not react until they see confirmation from other technical sources.
In any event, learning to recognise key candlestick patterns is essential to becoming an effective forex trader. In the article that follows, you will learn how to spot the bullish piercing line pattern, what messages it is conveying about market psychology, and how you might profit from its use via studying a recent real-time forex example. Lastly, if you are searching for a broker, we have prepared a list of the very best ones for your consideration.
What Is the Bullish Piercing Line Forex Pattern?
Let’s look at a real-time forex example of the EUR/GBP daily chart:
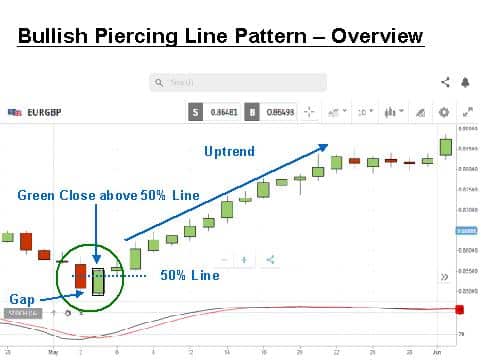
The chart is courtesy of eToro, and we have added a few annotations to illustrate the component parts of the bullish piercing line pattern. The green circle contains the required companion pair of candlesticks. We have enclosed the second candle with a box, but for this example, a true ‘gap’ between the red close and the green open did transpire. The closing price for the green candle has also occurred above the 50% line for the body of the red down candle.
This candle formation is easy to spot and has a moderately high potential for signalling a reversal of a strong downtrend or a reversal for a brief pullback of an uptrend. Seasoned traders will react quickly to this alert, as can be seen from the resulting strong uptrend that followed it. When learning this pattern, you may also want to review other similar formations – the bullish engulfing pattern, the on and in neck pattern, the thrusting pattern, and the meeting lines pattern.
What Does the Bullish Piercing Line Candlestick Mean?
The beauty of recognising various candlestick patterns is that they immediately form a picture of what is going on in the minds of other traders and investors. There is a psychology to market movements, and values are also often driven by market sentiment alone. In this familiar shape, we have a ‘gap’ in pricing. There is an old adage in investment and trading circles that says that the market will always fill a gap. Understanding this saying is key to understanding the meaning behind the bullish piercing line pattern.
What does ‘filling the gap’ mean? Pricing gaps can form after an announcement or event, but over-exuberant traders can also push hard enough to cause an opening gap from the previous day’s close, as shown in the above overview graphic for the piercing pattern. There are various gap forms, but here we have what is called an exhaustion gap – sellers have pushed too hard on prices, but volume dried up quickly, and buyers stepped in to reverse the trend.
In our example, buyers not only filled the gap, but they also pushed the price beyond 50% of the body of the previous down candle, a sign of strength. Strength can be measured by how far above the 50% line the green candle closed. If it had closed above the red body, then we would have had a bullish engulfing pattern, another moderately high-probability prediction of an imminent reversal. Market sentiment has shifted, and in this case, the bulls are on the run. The signal is to go long on the euro, but confirmation from another technical source is always advised.
How to Trade the Bullish Piercing Line Candlestick Forex Pattern
For educational purposes, we have annotated our overview example to show how a trading strategy might work for this bullish piercing line candlestick formation. All prerequisites are present – strong downtrend, pricing gap and a green candle closing above the 50% line, the ‘piercing line’, and an indication that market sentiment has shifted. We have also added the stochastics oscillator, which is confirming a shift in oversold conditions.
It is time to go long on the euro and place a stop loss at the bottom of the green candle. The signals suggest a moderately strong reversal, but it is always wise to look at the larger picture and not only the candles in isolation. How long and strong was the downtrend? Is the signal for a reversal of a downtrend or for a reversal of a pullback from an uptrend?
In this case, the uptrend movement was a strong one. When do we close the position? The trend does level out with a few gaps in pricing, as noted on the chart. A conservative trader would take profits at this point. An aggressive trader might move the stop loss higher and continue on. The ‘spinning tops’ suggest indecision, but one gap remains unfilled. The yield on this trade from a conservative perspective could have ranged from 200 to 300 pips, a very positive result.
The piercing line pattern can be a false signal, as is the case with all technical constructs. Take time on your demo system to study various market reactions. A volatile market with large candles can give mixed results. Observe what happens at different times during the day as the market can be irrational, especially when one centre opens as another is closing. We chose stochastics in this example as it behaves well during a trend, but you may prefer another favourite.
Conclusion
Learning to recognise a variety of candlestick patterns can only make you a better trader, and the bullish piercing line pattern is only one of many formations to learn. It comprises two separate candles, one red and one green. It primarily forecasts a reversal of a strong downtrend or the continuation of an uptrend after a brief pullback.
The bullish piercing line formation is not perfect, but it does provide a moderately high reversal signal, especially when combined with other technical tools and an assessment of market conditions. As a training exercise, review the pricing history of your favourite trading pair and then locate the bullish piercing line pattern. Observe how the market reacted and what the prevailing market conditions were at hand. When comfortable, incorporate this formation in your daily trading plan.
Trade Candlestick Patterns with Top Forex Brokers
| Broker | Features | Regulator | Platforms | Next Step | |
|---|---|---|---|---|---|
 Your capital is at risk
Founded: 2014 Your capital is at risk
Founded: 2014 |
|
FSPR | MT4 | ||
 Your capital is at risk
Founded: 2006 Your capital is at risk
Founded: 2006Europe* CFDs ar... |
|
ASIC, FSA, FSB, MiFID | MetaTrader4, Sirix, AvaOptions, AvaTrader, Mirror Trader | ||
|
Between 74-89 % of retail investor accounts lose money when trading CFDs |
|
ASIC, FCA | MetaTrader 4, MetaTrader 5, cTrader | ||
|
|
|
ASIC, CySEC, IFSC | MT4 Terminal, MT4 for Mac, Web Trader, iPhone/iPad Trader, Droid Trader, Mobile Trader, MT5 | ||
 Your capital is at risk
Founded: 2006 Your capital is at risk
Founded: 2006 |
|
CySEC, DFSA, FCA, FSB, SIA | MetaTrader4, MetaTrader5, cTrader, FxPro Edge (Beta) | ||
|
|
|
CySEC, FSC, FSCA, MISA | MT4, MT5, OctaTrader | ||

Forextraders' Broker of the Month
BlackBull Markets is a reliable and well-respected trading platform that provides its customers with high-quality access to a wide range of asset groups. The broker is headquartered in New Zealand which explains why it has flown under the radar for a few years but it is a great broker that is now building a global following. The BlackBull Markets site is intuitive and easy to use, making it an ideal choice for beginners.