
Instrument | Price | Hourly | Daily |
EUR/USD | 1.1035 | Strong Sell | Strong Sell |
GBP/USD | 1.3129 | Strong Buy | Strong Sell |
USD/JPY | 122.56 | Neutral | Strong Buy |
S&P 500 | 4,544 | Neutral | Strong Buy |
NASDAQ 100 | 14,855 | Neutral | Strong Buy |
FTSE100 | 7,543 | Strong Buy | Strong Buy |
Gold | 1,929 | Strong Buy | Neutral |
Crude Oil WTI | 99.89 | Buy | Sell |
Bitcoin | 46,066 | Strong Buy | Strong Buy |
Ethereum | 3,491 | Strong Buy | Strong Buy |
UTC 09:10
Our trading signal analysis is based on a comprehensive summary of market data. We use a range of metrics with weighting given to simple and exponential moving averages and key technical indicators.
We created this Weekly Tips section to share possible trade entry and exit points based on our technical analysis. We also have other methods to validate our trades that we can’t publicly share that help to increase their success. All our trades include entry and at least one target price. Stop losses are applied at the reader’s discretion. Our strategies typically trade with a wide stop loss, and risk is further mitigated by trading in small sizes.
The FTSE 100 equity index, the euro-dollar currency pair, and crypto market indicators point towards short-term strength and long-term weakness. Trading decisions need to be made with holding periods in mind, and choppy market conditions could prevail in the run-up to the Fed’s big announcement.
FOCUS ON: Traditionally Strong Q2 Comes Into Play
The US Jobs numbers released on Friday 1st April had minimal impact on the recovery rally in risk-on assets. US unemployment levels for March were lower than forecast, but at the same time, new jobs created also came in below expectations. The mixed bag of results saw major equity indices trading sideways and bracing themselves for April, which is traditionally one of the best performing months for stocks.
History isn’t a guide to future performance, but it can give a steer on market mood. April is historically the best month for stocks, with the average performance data for the S&P 500 being a gain of 1.7% and 70% of April’s being up months.
The extreme volatility seen in Q1 could continue into Q2 and disrupt the month’s attempts to stick with its track record. Geopolitical risk and surging commodity prices are still driving a large part of market sentiment
The week ahead is quiet in terms of planned news events, which could leave room for technical analysis strategies based on price support and resistance levels to play out. The possible fundamental analysis based bumps in the road are limited to the Reserve Bank of Australia making its interest rate announcement on Tuesday, the China factory gate price report also due on Tuesday and the US Fed releasing minutes of its last interest rate meeting on Wednesday.
Indices
NASDAQ 100
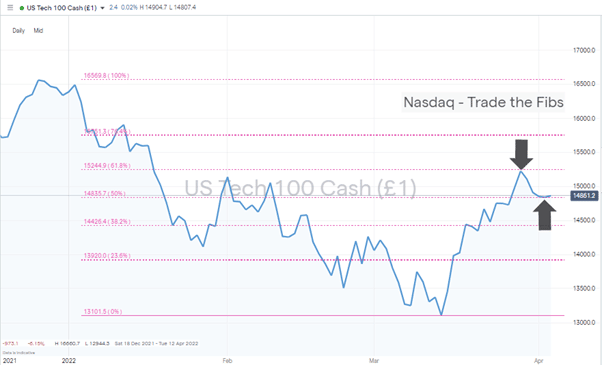
The break of the multi-month downward trend line, which dates back to the start of 2022, has held and has recently been marked by a period of price consolidation. With the coming week being light in terms of market news, it could be that a period of range-bound trading takes place. The key price levels so far marked out are between the 61.8% Fibonacci retracement level (15,245) and the 50% Fib (14,835). A breakout to the upside or downside could be the start of a new trend.
Nasdaq 100 Chart – 1Day Candles – Rangebound Trading Within Fib Retracement Levels
Source: IG
Long positions
- Entry Level 1: 14,835 – 50% Fib retracement level of the price crash seen in Q1 of 2022. Some caution needs to be applied because this price level is just below a big ‘round number’ level of 15,000. If the minutes of the latest FOMC meeting offer any suggestion that the US Federal Reserve might take a less hawkish view on interest rates, it could create a bounce in tech stocks.
- Price Target 1: 15,000 – Psychologically important ‘round number’ price level.
- Price Target 2: 15,245 – 61.8% Fibonacci retracement level
- Stop Loss: < 14,800
Short positions
- Entry Level 1: 15,245 – Using the 61.8% Fib retracement level as a starting point for trading the current price range to the downside.
- Price Target 1: 15,000 – Psychologically important ‘round number’ price level.
- Price Target 2: 15,835 – 50% Fibonacci retracement level and bottom end of the sideways trading range
- Stop Loss: > 15,300
FTSE 100
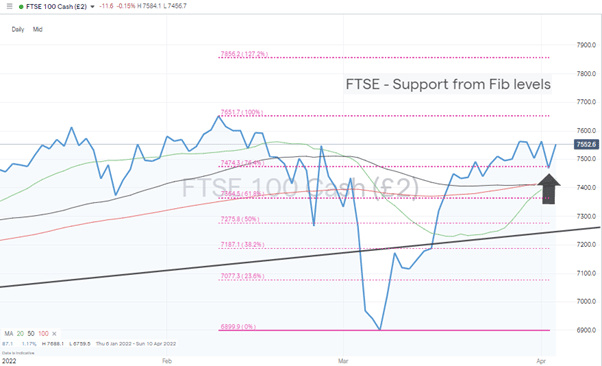
Technical indicators pick out the UK’s stock index as the one most likely to continue its upward momentum. That is partly due to the heavy weighting the index has with oil and mining stocks which are benefitting from a commodity price boom. There is also the multi-year relative underperformance of the index to factor in with the cyclical stocks in the index beginning to play ‘catch up’ with tech stock-based indices. Continued strength in the FTSE 100 was forecast last week, with the path of least resistance still appearing to be upwards.
FTSE 100 Daily Price Chart – Little Resistance to Further Upward Movement
Source: IG
A supporting indicator for those following bullish strategies is that on a Daily Chart price is trading above all three of the key Simple Moving Averages.
Long positions
- Entry Level 1: 7,474 – Dip-buying in the region of the 76.4% retracement level was proposed in last week’s report, and those following that strategy will already be in winning positions
- Price Target 1: 7,667 – Year-to-date high recorded in February. There is minimal resistance between current price levels and a test of the YTD high.
- Stop Loss: < 7,400 – Region of the 20, 50 and 100 SMA’s and a big-number price support level.
Oil
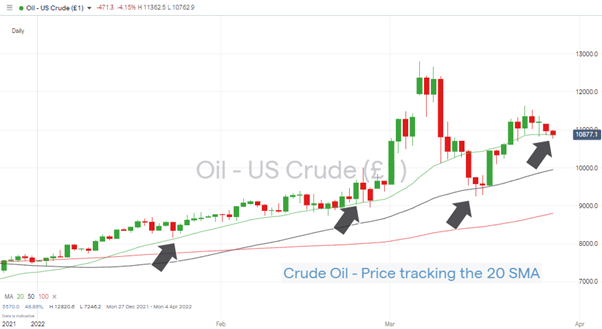
Technical indicators point to oil price volatility levels dropping off in the coming week. With price trading below the all-important $100 mark, those already in long positions may see price strength as an opportunity to scale out of positions and lock in profits.
US Crude Oil – Daily Price Chart – Still Tracking the 20 SMA
Source: IG
Short positions
- Entry Level 1: 104.16 – Using the 20 SMA on the Daily Price Chart as a guide and based on an expectation that a test of the $100 price level could be expected to overshoot to the top side, thanks to bulls triggering stop losses on those selling short at the big-number price level.
- Price Target 1: 92.44 – Price low of 15th March. A move below this swing-high indicator would represent the Daily Price Chart forming a bearish pattern.
- Stop Loss: > 116.31 – Price high of 23rd March.
Forex
EURUSD
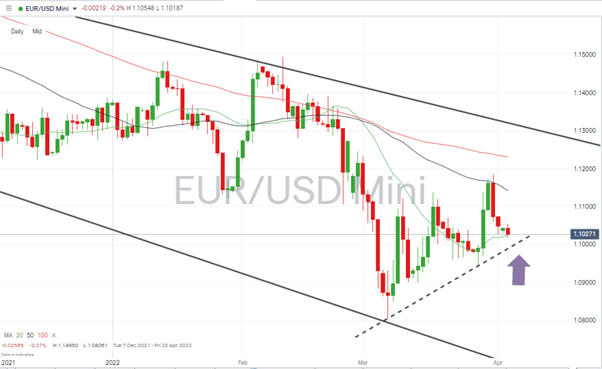
Euro’s price rise and subsequent fall last week highlights a trading range being established between the 50 and 100 SMA’s on the Daily Price Chart. With price holding above the key 1.10 price bar and support from the 20 SMA also coming into play, there is every chance price can bounce off the supporting trend line and push on upward from here.
EURUSD – Daily Price Chart – Bullish Indicators
Source: IG
Long positions
- Entry Level 1: 1.0995 – Using a test of the 1.10 price support, 20 SMA and supporting trendline as entry points into long positions.
- Price Target 1: 1.1142 – Region of the 50 SMA on the Daily Price Chart.
- Price Target 1: 1.12 – Psychologically important price level and region of the 100 SMA on the Daily Price Chart.
- Stop Losses: < 1.0975 – Current region of the 50 and 100 SMA and upper range of downwards channel.
Crypto – Bitcoin & Ethereum
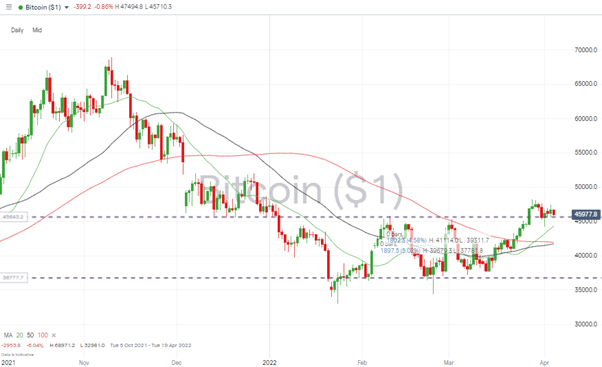
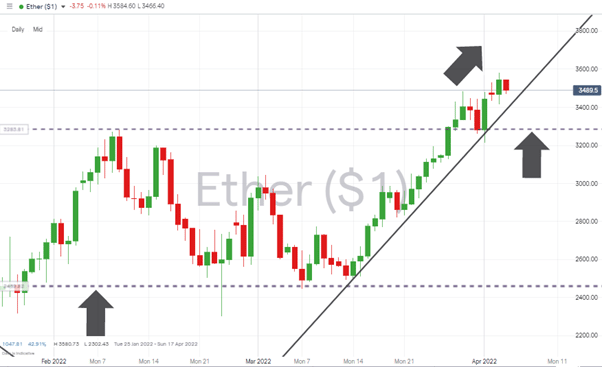
Ether continues to outperform Bitcoin largely thanks to investors buying into the prospects of the Ethereum network’s upcoming upgrade. Bitcoin was slightly down on a week-to-week basis and can’t quite push on from the 45,822-price level, which marks the price highs in February and March. In contrast, Ethereum’s 5% week-on-week price surge continues to point to more upward movement for ETH.
Bitcoin – Daily Price Chart – Price holding to key support/resistance level
Source: IG
Bitcoin Long positions
- Entry Level 1: 45,822 – Price high of 10th February.
- Price Target 1: 50,000 – ‘round number’ resistance.
- Price Target 2: 51,800 – Intraday low of 3rd December – using a gap-fill strategy.
- Stop Losses 1: < 44,288 – Region of 20 SMA on Daily Price Chart.
Ethereum – Daily price chart – Continuing Upward Momentum
Source: IG
Ethereum Long positions
Ether’s break out of its sideways channel now looks like a double-bottom or triple-bottom price pattern. The steep gradient of the supporting trendline demonstrates the power of the buying pressure. Until that line is broken, it’s time to keep on buying the dips.
- Entry Level: 3,461 – Region of supporting trendline.
- Price Target 1: 4,000 – Psychologically important ‘round number’ level, which acted as support in December and now has the potential to act as resistance.
- Stop Losses: < 3,284 – Price high of 10th February and upper end of sideways trading channel.
Risk Statement: Trading financial products carries a high risk to your capital, especially trading leverage products such as CFDs. They may not be suitable for everyone. Please make sure that you fully understand the risks. You should consider whether you can afford to take the risk of losing your money.

Forextraders' Broker of the Month
BlackBull Markets is a reliable and well-respected trading platform that provides its customers with high-quality access to a wide range of asset groups. The broker is headquartered in New Zealand which explains why it has flown under the radar for a few years but it is a great broker that is now building a global following. The BlackBull Markets site is intuitive and easy to use, making it an ideal choice for beginners.