
Instrument | Price | Hourly | Daily |
EUR/USD | 1.0728 | Strong Buy | Strong Buy |
GBP/USD | 1.2522 | Buy | Sell |
USD/JPY | 130.65 | Neutral | Strong Buy |
S&P 500 | 4,136 | Strong Sell | Neutral |
NASDAQ 100 | 12,663 | Sell | Neutral |
FTSE100 | 7,627 | Strong Buy | Strong Buy |
Gold | 1,853 | Neutral | Neutral |
Crude Oil WTI | 117.61 | Neutral | Strong Buy |
Bitcoin | 31,186 | Buy | Neutral |
Ethereum | 1,882 | Strong Buy | Strong Sell |
UTC 09:36
Our trading signal analysis is based on a comprehensive summary of market data. We use a range of metrics with weighting given to simple and exponential moving averages and key technical indicators.
We created this Weekly Tips section to share possible trade entry and exit points based on our technical analysis. We also have other methods to validate our trades, which we can’t publicly share, that help increase their success. All our trades include entry and at least one target price. Stop losses are applied at the reader’s discretion. Our strategies typically trade with a wide stop loss, and risk is further mitigated by trading in small sizes.
The FTSE 100 equity index, the euro-dollar currency pair, and crypto market indicators point towards short-term and long-term strengths. Trading decisions need to be made with holding periods in mind, and choppy market conditions could prevail in the run-up to the Fed’s big announcement.
FOCUS ON: Major Central Bank Rate Decisions Make It A Big Week For Forex
An action-packed news week greets investors wondering if last week’s sell-off represents the start of the next down-leg in risk assets. The US Federal Reserve’s interest rate announcement on Wednesday 15th June is the crucial data point of the week and will be followed by a press conference with Fed Chair Jerome Powell.
A consensus had formed that the Fed would raise rates by 50 basis points, but that is beginning to crack following last week’s red-hot US inflation announcement. The probability of a 0.75% rate hike is now being priced in at 20% rather than 5%. Should that shock rate hike materialise, then extreme volatility can be expected to follow.
The Fed’s big announcement would be enough to put traders on edge but is surrounded by a range of other potentially market-moving announcements this week.
Monday 13th June
- UK – Monthly GDP, Trade Balance
- US – Consumer Inflation Expectations
Tuesday 14th June
- UK – Unemployment Rate
- Eurozone – Industrial Production
- US – Producer Price Index, API Crude Oil Inventories
Wednesday 15th June
- Australia – Westpac Consumer Confidence
- China – Industrial Production
- US – Retail Sales, Fed Interest Rate Decision
Thursday 16th June
- UK – BOE Interest Rate Decision
- Switzerland – SNB Interest Rate Decision
- US – Initial Jobless Claims
Friday 17th June
- Japan – BOJ Interest Rate Decision
- Canada – Producer Price Index
Will the commotion caused by a full-blooded round of key announcements provide the opportunity for markets to bottom out, or is the downward momentum set to continue? The only certainty is uncertainty; however, that means there will be plenty of opportunities for traders looking to enter into long and short positions.
Forex
GBPUSD
The Bank of England will update the market on interest rate policy on Thursday. UK unemployment figures precede that announcement and are due on Tuesday. The interest rate update provided by the US Fed on Wednesday can also be expected to influence the Bank’s decision. Analysts are torn about whether UK base rates will go up 0.25%, which would take the UK interest rate to the highest level for 13 years.
Advocates of hawkish policy point to sky-rocketing prices being driven by a weak pound. Eight per cent of the year-to-date increase in petrol prices can be attributed to the currency effect of the pound weakening and crude oil being priced in USD. On the other hand, the cost-of-living squeeze threatens to trim consumer demand and send the UK economy into a recession. It’s a tough call, but if the Bank does hold off on a rate hike, that will send sterling into a tailspin.
The Monetary Policy Committee has increased rates at its last four meetings, and three of the nine members of the MPC voted at the May meeting for rates to already be at 1.25%. But the jury is currently out, which makes Thursday’s announcement a key one for any traders with a position in GBP currency pairs.
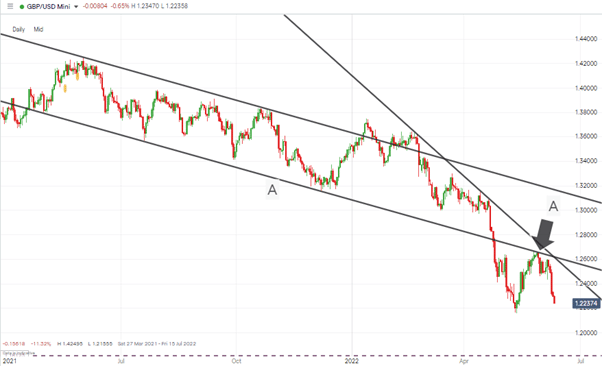
The long-term downward trend line in GBPUSD, line ‘A’ in the below chart, dates back to April 2021 and was highlighted in this report as a resistance level too far for the recent relief rally, and so it turned out. The pace of the sell-off suggests a test of the 1.2155 May low is highly probable, with any move below that level representing a chance to implement a breakout strategy.
GBPUSD Chart – 1 Day Candles – Relief Rally Reverses
Source: IG
Short positions
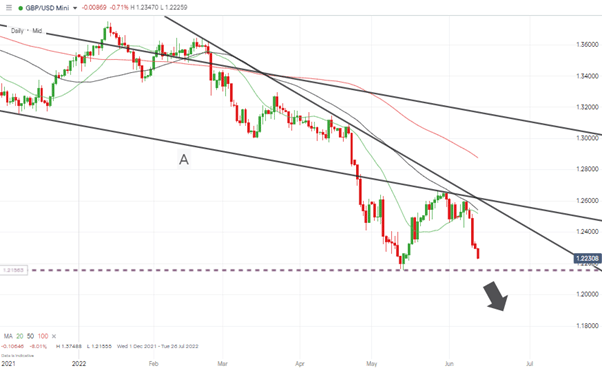
- Entry Level 1: 1.2155 – Waiting for a breach of the two-year low to be confirmed.
- Price Target 1: 1.2000 – Psychologically important ’round number’ price level.
- Price Target 2: 1.1409 – Price low of March 2020.
- Stop Loss Option 1: > 1.25193 – Region of the 20 SMA on the Daily Price Chart
- Stop Loss Option 2: > 1.258 – Region of the downward trendline ‘A’.
GBPUSD Chart – 1 Day Candles – Break Out Strategy and 20 SMA Stop Loss
Source: IG
EURUSD
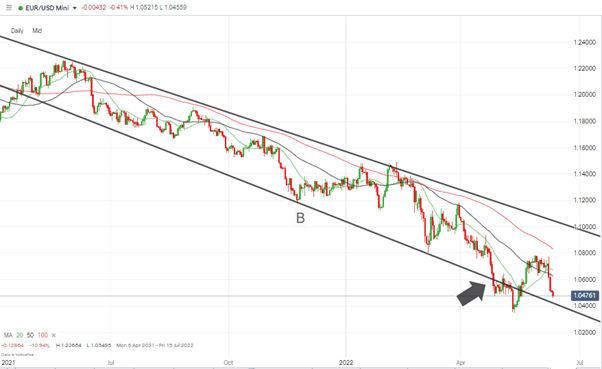
Eurodollar’s price channel dating back to April 2021 looks set to be tested again this week. Further downward price moves followed the breach of the supporting trend line occurring on 28th April 2022, but EURUSD eventually climbed back into the long-term trading range on 18th May 2022.
The ECB’s rate decision last week has done little to calm investors’ nerves and was followed by a sell-off that took price through the 20, 50, and 100 SMAs on the Daily Price Chart. Now trading below those key metrics, the path of least resistance appears to be down with the ‘stick or twist’ moment to come when price reaches the supporting trendline (B) which is currently in the region of 1.041.
EURUSD Chart – 1 Day Candles – Ready to Test Supporting Trendline
Source: IG
Short positions
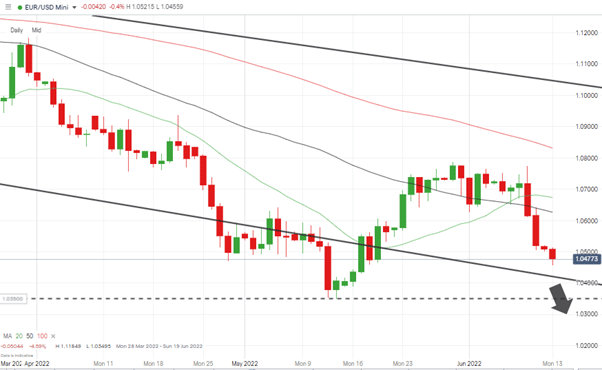
- Entry Level 1: 1.042 – Region of the long-term supporting trendline.
- Price Target 1: 1.034 – Year to date price low recorded on 13th May 2022.
- Stop Loss: > 1.0626 – Region of the 50 SMA on the Daily Price Chart.
Long positions
- Entry Level 1: 1.042 – Region of the long-term supporting trendline.
- Price Target 1: 1.0626 – Region of the 50 SMA on the Daily Price Chart.
- Stop Loss: < 1.034 – Year to date price low recorded on 13th May 2022.
EURUSD Chart – 1 Day Candles – Price Targets
Source: IG
USDJPY
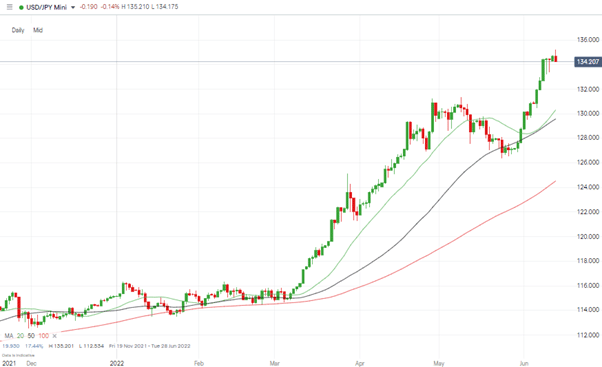
Whilst the outlook for USDJPY remains bullish, the divergence from the SMAs suggests price could be due a period of consolidation or even a pullback. Any softening in price can be seen as an opportunity to go long.
The Bank of Japan will update on interest rates on Friday, 17th June, so a period of sideways trading in anticipation of that event can’t be discounted.
USDJPY Chart – 1 Day Candles – Chance of Price Consolidation
Source: IG
Short positions
- Entry Level 1: 135.20 – Year to date price high printed on Monday 13th June 2022.
- Price Target 1: 130.30 – Region of the 20 SMA on the Daily Price Chart.
- Price Target 2: 129.57 – Region of the 50 SMA on the Daily Price Chart. Price target 1 is favoured as the 50 SMA currently sits just below the psychologically important 130.00 price level, which can be expected to provide support.
- Stop Loss: > 135.20 – Year to date price high printed on Monday 13th June 2022.
Long positions
- Entry Level 1: 130.30 – Region of the 20 SMA on the Daily Price Chart.
- Price Target 1: 135.20 – Year to date price high printed on Monday 13th June 2022.
- Stop Loss: < 129.57 – Region of the 50 SMA on the Daily Price Chart. Below 1.30 ’round number’ price support.
Indices
NASDAQ 100
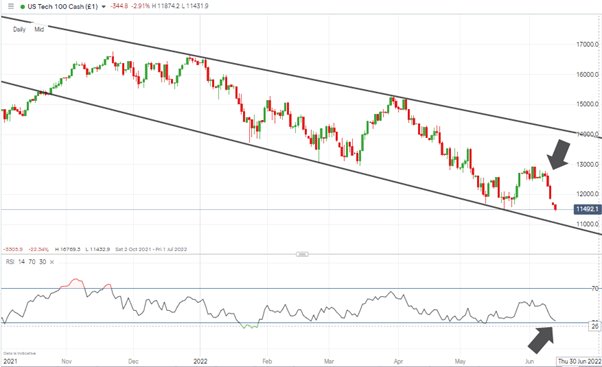
The blistering US inflation report released last week made growth stocks too hot to handle and precipitated another multi-session sell-off in the Nasdaq. The index is approaching an RSI of 30 on the Daily Price Chart, and that metric has a good track record of indicating the point at which the market bounces.
The consensus is that any rebound would still represent a relief rally rather than a fundamental change in the direction of the trend, but short-term strength can’t be ruled out.
NASDAQ 100 Chart – 1 Day Candles – RSI Approaching 30
Source: IG
Long positions
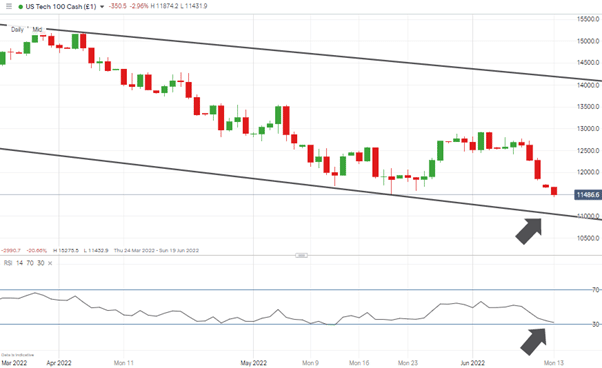
- Entry Level 1: 11,067 – Region of the supporting trendline, which dates from 21st January 2022.
- Price Target 1: 12,231 – Region of the 20 SMA on the Daily Price Chart.
- Price Target 2: 12,929 – Month to date price high recorded on 3rd June 2022. Just below the 13,000 ’round number’ price bar.
- Stop Loss: < 10,900. – below supporting trendline and 11,000 ’round number’ price level.
Short positions
- Entry Level 1: 11,067 – Breakout strategy based on a breach of the supporting trendline.
- Price Target 1: 10,915 – Price low of September 2020.
- Stop Loss: > 12,661 – Region of the 50 SMA on the Daily Price Chart.
NASDAQ 100 Chart – 1 Day Candles
Source: IG
Oil
Analysts continue to upgrade their long-term price targets for crude, so buying the dip remains a critical consideration. It’s mainly a question of which of the technical indicators to choose to spot an entry point. The 100 SMA on the Daily Price Chart remains the favourite option for the more patient, but the 20 SMA has recently offered effective support.
US Crude Oil – 1 Day Candles – Still following the 20 SMA
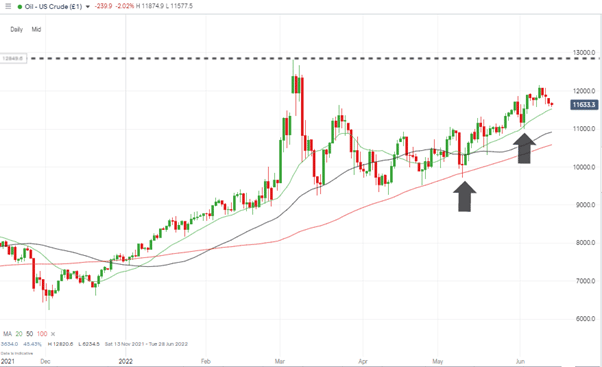
Source: IG
Long positions
- Entry Level 1: 115.23 – Region of the 20 SMA on the Daily Price Chart.
- Entry Level 2: 105.84 – Region of the 100 SMA on the Daily Price Chart.
- Price Target 1: 128.20 – Price high of 6th March 2022.
- Stop Loss: < 107.49 or 98.84 – 23.6% and 38.2% Fibonacci retracement levels of the bull run dating from December 2021.
Crypto – Bitcoin & Ethereum
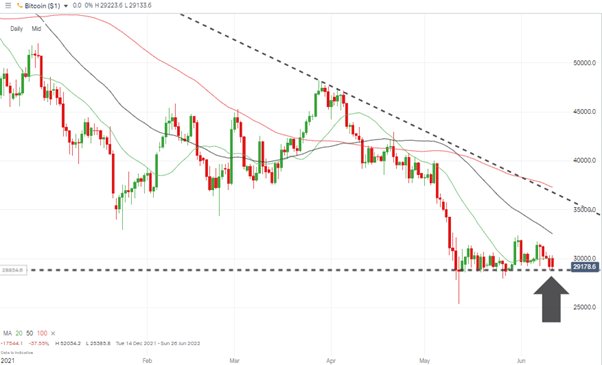
Both major cryptos lost ground this week. Bitcoin’s slide reflects the general move away from risk-on assets, but it has managed to hold its key support level. Ethereum is still waiting for the move from proof of work to proof of stake protocols to be confirmed to the extent it is seen as a catalyst.
Bitcoin Chart – 1 Day Candles – Price Support Levels
Source: IG
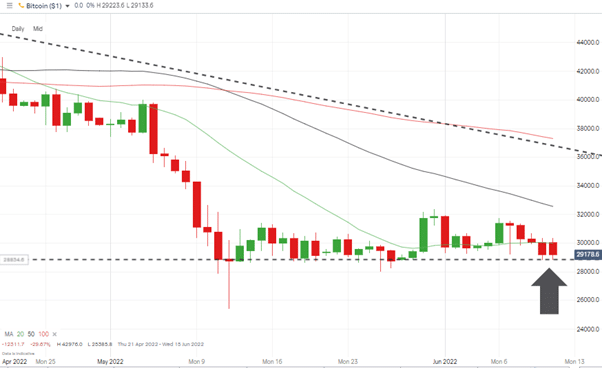
Bitcoin Long positions
- Entry Level 1: 28,912 – Support level which formed on 12th May 2022.
- Price Target 1: 32,556 – Region of 50 SMA on Daily Price Chart
- Price Target 2: 37,299 – Region of the 100 SMA on the Daily Price Chart, resistance trendline dating from 24th January 2022.
- Stop Losses: < 25,385 – Below price low of Friday 13th May 2022.
Bitcoin Chart – 1 Day Candles –Support level
Source: IG
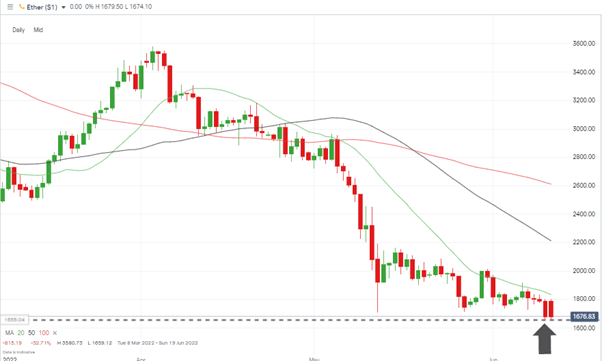
Ethereum is printing new year-to-date lows, but the test of support levels has so far looked unconvincing. Any change in mood brought on by the US interest rate announcement could be expected to result in high percentage point returns for those willing to buy the current dip.
Ethereum Chart – 1 Day Candles – Trading below the key $2,000 price level and SMA resistance
Source: IG
Ethereum Long positions
- Entry Level 1: 1,650 – Region of the year to date low.
- Price Target 1: 1,832- Region of the 20 SMA on the Daily Price Chart.
- Price Target 2: 2,211 – Region of the 500 SMA on the Daily Price Chart.
- Stop Losses: < 1,412 – Price low of 1st March 2021.
Risk Statement: Trading financial products carries a high risk to your capital, especially trading leverage products such as CFDs. They may not be suitable for everyone. Please make sure that you fully understand the risks. You should consider whether you can afford to take the risk of losing your money.

Forextraders' Broker of the Month
BlackBull Markets is a reliable and well-respected trading platform that provides its customers with high-quality access to a wide range of asset groups. The broker is headquartered in New Zealand which explains why it has flown under the radar for a few years but it is a great broker that is now building a global following. The BlackBull Markets site is intuitive and easy to use, making it an ideal choice for beginners.