
Instrument | Price | Hourly | Daily |
EUR/USD | 1.0530 | Strong Buy | Strong Sell |
GBP/USD | 1.2238 | Strong Buy | Strong Sell |
USD/JPY | 134.82 | Neutral | Strong Buy |
S&P 500 | 3,683 | Strong Sell | Strong Sell |
NASDAQ 100 | 11,321 | Neutral | Strong Sell |
FTSE100 | 7,010 | Strong Sell | Strong Sell |
Gold | 1,843 | Strong Buy | Sell |
Crude Oil WTI | 108.24 | Sell | Strong Sell |
Bitcoin | 20,055 | Strong Sell | Strong Sell |
Ethereum | 1,079 | Strong Sell | Strong Sell |
UTC 08:56
Our trading signal analysis is based on a comprehensive summary of market data. We use a range of metrics with weighting given to simple and exponential moving averages and key technical indicators.
We created this Weekly Tips section to share possible trade entry and exit points based on our technical analysis. We also have other methods to validate our trades that we can’t publicly share that help to increase their success. All our trades include entry and at least one target price. Stop losses are applied at the reader’s discretion. Our strategies typically trade with a wide stop loss, and risk is further mitigated by trading in small size.
The FTSE 100 equity index, the euro-dollar currency pair, and crypto market indicators are all pointing towards short-term strength and long-term weakness. Trading decisions need to be made with holding periods in mind and choppy market conditions could prevail in the run-up to the Fed’s big announcement.
FOCUS ON: GBPUSD Lines Up For Crucial Inflation Reading
Last week’s major news announcements certainly shook up the markets, but the week-on-week price changes suggest that risk appetite could be stabilising. The Fed’s 0.75% interest rate hike led to the Nasdaq 100 closing down 4.3% on Wednesday, but it recovered some ground in the run-in to the weekend. In forex markets, EURUSD was up on the week and GBPUSD closed slightly down. The different fortunes of those two major currency pairs point to the dollar taking a breather while investors reassess where they are at the halfway point of a roller-coaster year.
The coming week has a quieter feel to it, which could lead towards more price consolidation. US stock markets are closed on Monday 20th June to celebrate the Juneteenth national holiday, and the pick of the upcoming news announcements is the release of CPI consumer inflation numbers in the UK on Wednesday. The Bank of England’s decision last week to raise rates by ‘only’ 0.25% reflects the difficulty facing the UK economy, which could be about to embark on a period of stagflation.
Another report that might be read with more interest this week is the US New House Sales statement due to be issued on Friday. With the US economy teetering on the edge of a recession, this bellwether could be used to gain an insight into ground-level consumer sentiment.
Monday 20th June
- China – Loan Prime Rate
- Germany – Producer Price Index
Tuesday 21st June
- Australia – RBA Minutes
- US – Chicago Fed National Activity
- Canada – Retail Sales
Wednesday 22nd June
- Japan – BOJ Minutes
- UK – Consumer Price Index (CPI)
- Eurozone – Consumer Confidence
Thursday 23rd June
- UK, Eurozone & US – PMI Flash Report
- US – Initial Jobless Claims
- US – Fed Stress Test Results
Friday 24th June
- UK – Consumer Confidence and Retail Sales
- US – New Home Sales
Forex
GBPUSD
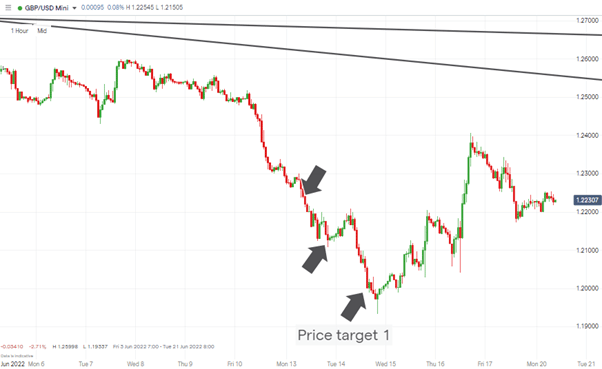
The first part of last week mapped out as predicted in the Weekly Trading Ideas report. Cable continued in its long-term downwards channel and price entry point (short GBPUSD at 1.2155) was followed by a time spent on Tuesday below the psychologically important 1.20 price level, which was Price Target 1.The move was driven by the US Fed raising rates by 0.75%, which was at the high end of expectations, and the Bank of England (BOE) following with an inline increase of 0.25%. The BOE began its own round of interest rate hikes some months before the Fed, but there is still room for 0.50% rather than 0.25% incremental rises should the Governor of the BOE decide that inflation takes priority over job numbers.
GBPUSD Chart – 1-Hour Candles – Price Target 1 & Rebound
Source: IG
The rebound in GBPUSD during the latter part of last week caught many by surprise. Fundamental analysis can partially explain this being based on signs from the BOE that it is ready to adopt a more hawkish approach – which brings Wednesday’s inflation report into focus. It’s expected to be red hot, with some predicting CPI reaching as much as 11%.
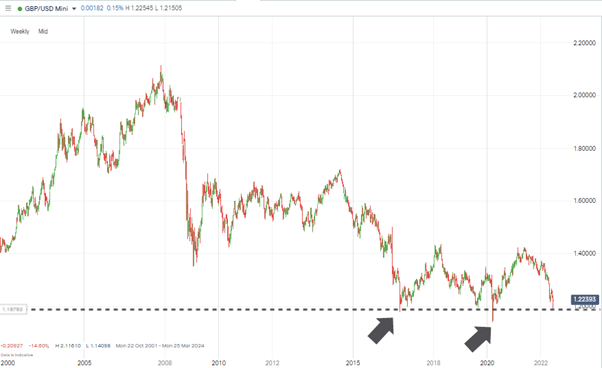
Technical analysis points to the downward move being only temporarily held up. The GBPUSD currency pair is pushing levels only seen twice since 2000, and short-term reversals come as standard with breakout strategies. The currency pair is at levels only seen during the height of the COVID-19 crisis (March 2020) and the time of the Brexit vote (September 2016).
GBPUSD Chart – 1-Week Candles – New Lows
Source: IG
Short positions
- Entry Level 1: 1.2155 – Waiting for a second breach of the two-year low to be confirmed.
- Price Target 1: 1.2000 – Psychologically important ‘round number’ price level.
- Price Target 2: 1.1409 – Price low of March 2020.
- Stop Loss Option 1: > 1.24069 – Price high of Thursday 16th June 2020 and region of 20 SMA on the Daily Price Chart.
Long positions
- Entry Level 1: 1.2155 – Taking the price low of March 2022 as a support level
- Price Target 1: 1.24016 – Region of the 20 SMA on the Daily Price Chart.
- Stop Loss: < 1.20 – ‘Round number’ and psychologically important support level.
EURUSD
The dovish guidance that accompanied the European Central Bank’s (ECB) most recent rate decision saw it join the US Fed as a central bank many considered to be doing too little, too late, to control inflation. The US central bank’s 0.75% rate hike of last week confirms that it has changed its approach, and the ECB could be about to follow.
With eurozone inflation pushing 8%, a change in approach can be put through without too much loss of face. The 0.25% rate hike most have had forecast for July could even be scaled up to 0.50% and this has resulted in EURUSD recently showing strength.
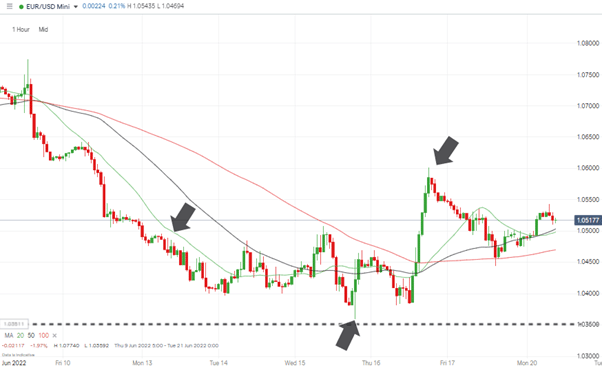
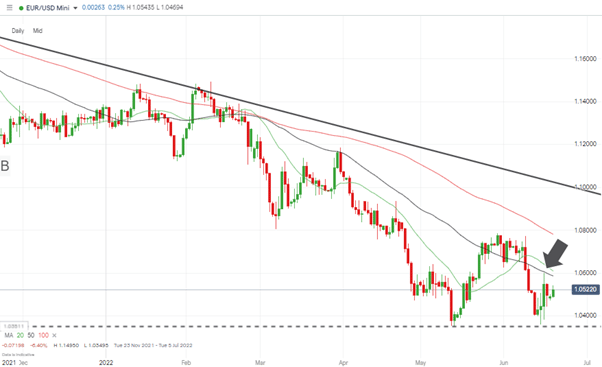
Both of the short and long EURUSD trade ideas paid off last week if played in the right order, but with price flip-flopping, some caution is needed. The 50 SMA on the Daily Price Chart was correctly tipped as being a sensible Price Target 1 for long positions and could continue to put a cap on upwards movement. Downside price moves can’t be ruled out, but these look to be limited due to the increasingly hawkish tone adopted by the ECB.
EURUSD Chart – 1-Hour Candles
Source: IG
Short positions
- Entry Level 1: 1.060 – Price high of Thursday 16th June 2022.
- Price Target 1: 1.047 – Region of the 100 SMA on the Hourly Price Chart.
- Price Target 2: 1.034 – Year-to-date price low recorded on 13th May 2022.
- Stop Loss: > 1.078 – Region of the 100 SMA on the Daily Price Chart.
Long positions
- Entry Level 1: 1.049 – Region of the 20 SMA on the Hourly Price Chart.
- Entry Level 2: 1.047 – Region of the 100 SMA on the Hourly Price Chart.
- Price Target 1: 1.058 – Region of the 50 SMA on the Daily Price Chart.
- Stop Loss: < 1.034 – Year-to-date price low recorded on 13th May 2022.
EURUSD Chart – 1-Day Candles – 50 SMA
Source: IG
USDJPY
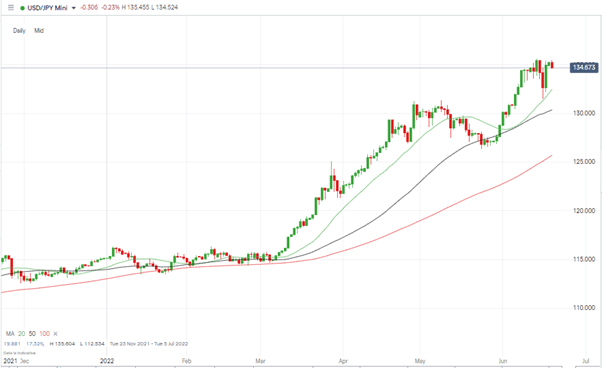
While UK and eurozone central banks are considering more aggressive interest rate policies, the Bank of Japan (BOJ) continues to adopt a dovish approach. Despite continued strength in USDJPY, the BOJ is not changing from its stated policy of ‘closely watching’ the yen conversion rates.
The pullback to the 20 SMA on the Daily Price Chart on Thursday 16th June provided an opportunity for those looking to go long to enter into trades. With dollar-yen now trading 2% higher than that trade entry point, the path of least resistance continues to appear to be upwards.
USDJPY Chart – 1-Day Candles
Source: IG
Short positions
- Entry Level 1: 135.60 – Year-to-date price high printed on Tuesday 14th June 2022.
- Price Target 1: 132.46 – Region of the 20 SMA on the Daily Price Chart.
- Price Target 2: 130.36 – Region of the 50 SMA on the Daily Price Chart. Psychologically important 130.00 price level can be expected to provide support.
- Stop Loss: > 136.00 – Round number price level.
Long positions
- Entry Level 1: 132.46 – Region of the 20 SMA on the Daily Price Chart.
- Price Target 1: 135.20 – Year-to-date price high printed on Tuesday 14th June 2022
- Stop Loss: < 130.00 – Below the 50 SMA on the Daily Price Chart and the psychologically important round number price support.
Indices
NASDAQ 100
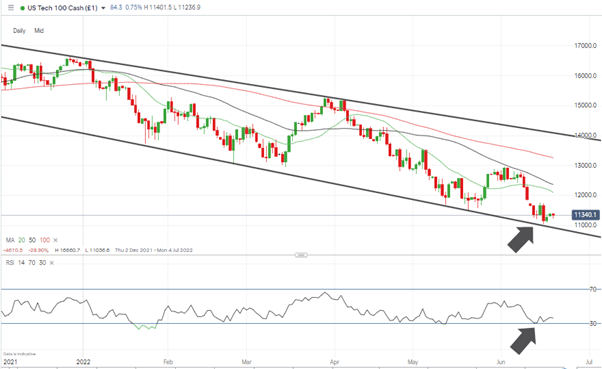
The bounce off the 30 RSI on the Daily Price Chart that occurred on Monday 13th June was short-lived. The index may be oversold on longer-term timeframes, but red-hot inflation forecasts continue to apply downward pressure on stock valuations.
NASDAQ 100 Chart – 1-Day Candles – Small bounce off RSI of 30
Source: IG
Long positions
- Entry Level 1: 10,895 – Region of the supporting trendline that dates from 21st January 2022.
- Price Target 1: 12,094 – Region of the 20 SMA on the Daily Price Chart.
- Price Target 2: 12,929 – Month-to-date price high recorded on 3rd June 2022. Just below the 13,000 ‘round number’ price bar.
- Stop Loss: < 10,850 – below supporting trendline and 11,000 ‘round number’ price level.
Short positions
- Entry Level 1: 10,895 – Breakout strategy based on a breach of the supporting trendline.
- Price Target 1: 10,915 – Price low of September 2020.
- Stop Loss: > 12,094 – Region of the 20 SMA on the Daily Price Chart.
Oil
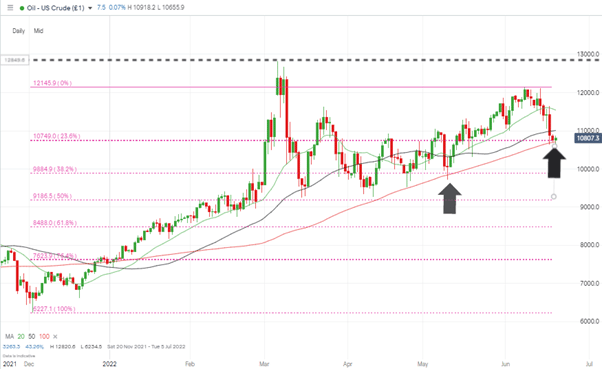
The current dip in oil has been brought about by fears of an economic slowdown, but price is still trading above the key support level represented by the 100 SMA on the Daily Price Chart. Those who have been patient enough to wait for price to reach our second trade entry point will now be able to enter into trades with relatively tight stop losses.
US Crude Oil – 1-Day Candles – 100 SMA & Fib Support
Source: IG
Long positions
- Entry Level 1: 107.10 – Region of the 100 SMA on the Daily Price Chart.
- Price Target 1: 128.20 – Price high of 6th March 2022.
- Stop Loss: < 98.84 – 38.2% Fibonacci retracement levels of the bull run dating from December 2021 and below the psychologically important $100 price level.
Risk Statement: Trading financial products carries a high risk to your capital, especially trading leverage products such as CFDs. They may not be suitable for everyone. Please make sure that you fully understand the risks. You should consider whether you can afford to take the risk of losing your money.

Forextraders' Broker of the Month
BlackBull Markets is a reliable and well-respected trading platform that provides its customers with high-quality access to a wide range of asset groups. The broker is headquartered in New Zealand which explains why it has flown under the radar for a few years but it is a great broker that is now building a global following. The BlackBull Markets site is intuitive and easy to use, making it an ideal choice for beginners.