
Instrument | Price | Hourly | Daily |
EUR/USD | 1.0143 | Strong Sell | Strong Sell |
GBP/USD | 1.1981 | Strong Sell | Strong Sell |
USD/JPY | 137.04 | Strong Buy | Strong Buy |
S&P 500 | 3,871 | Strong Buy | Buy |
NASDAQ 100 | 12,000 | Strong Buy | Neutral |
FTSE100 | 7,129 | Strong Buy | Sell |
Gold | 1,740 | Strong Sell | Strong Sell |
Crude Oil WTI | 101.00 | Strong Sell | Strong Sell |
Bitcoin | 20,452 | Strong Sell | Strong Sell |
Ethereum | 1,240 | Strong Sell | Strong Sell |
UTC 08:06
Our trading signal analysis is based on a comprehensive summary of market data. We use a range of metrics with weighting given to simple and exponential moving averages and key technical indicators.
We created this Weekly Tips section to share possible trade entry and exit points based on our technical analysis. We also have other methods to validate our trades which we can’t publicly share that help to increase their success. All our trades include entry and at least one target price. Stop losses are applied at the reader’s discretion. Our strategies typically trade with a wide stop loss, and risk is further mitigated by trading in small sizes.
The FTSE 100 equity index, the euro-dollar currency pair, and crypto market indicators are all pointing towards short-term strength and long-term weakness. Trading decisions need to be made with holding periods in mind, and choppy market conditions could prevail in the run-up to the Fed’s big announcement.
FOCUS ON: Risk-appetite Divergence Points To Possible New Trends
An interesting divergence between risk appetite in forex and equity markets points to the possibility of a new trend forming. Over the last week, a risk-on approach to stocks saw the Nasdaq 100 index put on 4.27% in value, but at the same time, currency markets saw risk-off trading. GBPUSD and EURUSD were down 1.14% and 2.78%, respectively, and the Japanese yen lost more than 1% in value against the greenback.
Possible scenarios for the jumbled mood in the markets include a ‘dead cat’ bounce in stocks after such a hard sell-off and a feeling that the run in the dollar is, in contrast, dead-set on testing the all-time record price levels against other currencies – which are now coming into range.
The alternative is that strength in equities could for a broader change in sentiment and that it could be a leading indicator of a turn in forex markets. After a multi-month sell-off, some market analysts are suggesting that the dramatic interest rate rises of the US Fed could result in inflation being tamed sooner than expected, leading to a dramatic about-face in risk appetite.
Something’s got to give, which means forex traders would do well to consider currency pairs taking steps in either direction. Wednesday 13th July is the day which could offer the most pointers. The Reserve Bank of New Zealand and the Bank of Canada will announce their latest interest rate levels on that day. China’s trade balance numbers will be released, US CPI numbers are also due, and industrial production and the all-important June GDP data in the UK will be announced.
US Dollar Basket Chart – Monthly Candles – All-time high?
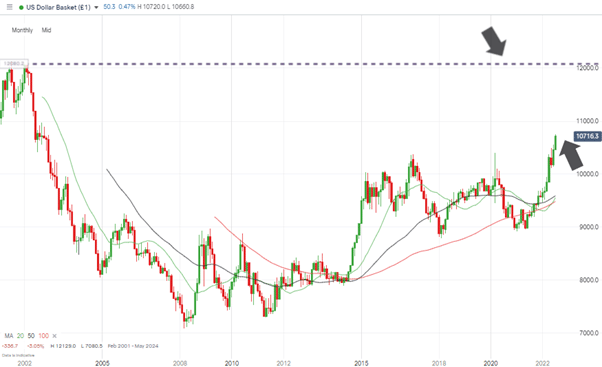
Source: IG
Forex
GBPUSD
The year-to-date price low of 1.1875 printed on Wednesday 6th July now looks like a critical indicator for GBPUSD. That marked when the currency pair tested the support associated with the long-term potential triple-bottom price pattern. The bounce back up to 1.2056 by Friday was relatively predictable given the number of traders who would have been tempted to buy near that support level. But price has since drifted back below the psychologically important 1.20 level.
GBPUSD Chart – Monthly Candles – Triple-Bottom?
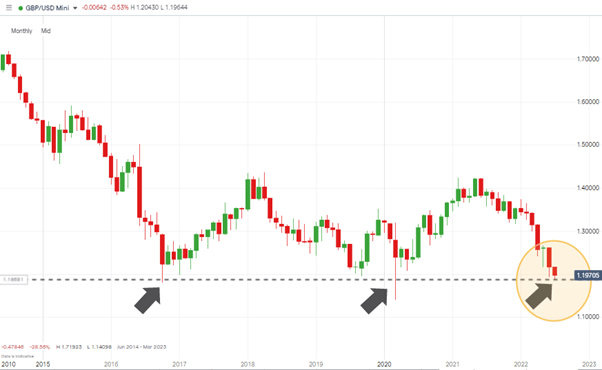
Source: IG
The question of how low could GBP go formed a significant part of last week’s Technical Analysis and Trading Ideas Report, and the 1.14% fall in the price of cable since then suggests the answer is that we still don’t know. But if anyone wanted to step in and buy GBP after its +12% price crash since February, then now would appear to be the time to test that strategy.
GBPUSD Chart – Daily Candles – Triple-bottom bounce?
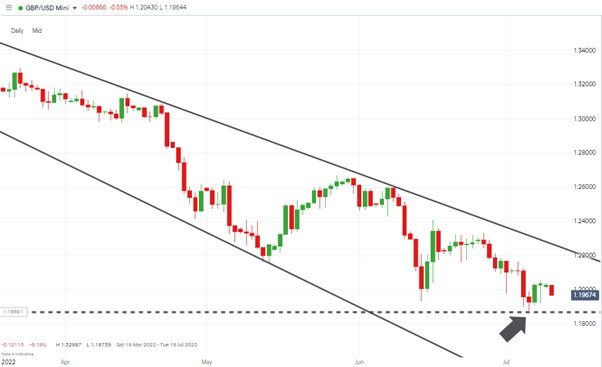
Source: IG
Short positions
- Entry Level 1: 1.1875 – Price low of Wednesday 6th July and year-to-date low. Using a breakout strategy based on capturing further downward momentum.
- Price Target 1: 1.14510 – Price low of March 2020.
- Stop Loss: > 1.24069 – Price high of Thursday 16th June 2020 and above the long-term trend line.
Long positions
- Entry Level 1: 1.20562 – Price high of Friday 8th July. Applying a breakout strategy again, this time weighted towards the upside.
- Price Target 1: 1.231 – Region of the upper trendline of the downward price channel.
- Stop Loss: < 1.11875 – year-to-date price low of 6th July 2022.
EURUSD
Eurozone economies and, therefore, the euro are coming under renewed pressure thanks to the risk that Russian gas supplies might be restricted. The Nord Stream pipeline is due to be shut for ten days for pre-planned annual maintenance. The threat now is that Russia might opt not to turn the taps back on afterwards to put pressure on EU governments over sanctions relating to the war in Ukraine. This is a reminder that the geopolitical situation in the region is still unstable and hampers efforts by EU countries to build up winter storage reserves.
EURUSD Chart – Daily Candles – Downside Breakout
Source: IG
Last week, the euro was the big loser out of the major currency pairs. Its 2.78% price slump took it through the 1.0354 price support, which was Price Target 1 for short positions picked out in last week’s Technical Analysis and Trading Ideas Report.
Short positions
- Entry Level 1: 1.0354 – Selling into any strength and revisiting the 1.0354 price level, which has turned from offering support to resistance.
- Price Target 1: 1.0072 – Year to date price low recorded on 8th July 2022 and region of potential triple-bottom.
- Stop Loss: > 1.0774 – Price high of 9th June 2022.
Long positions
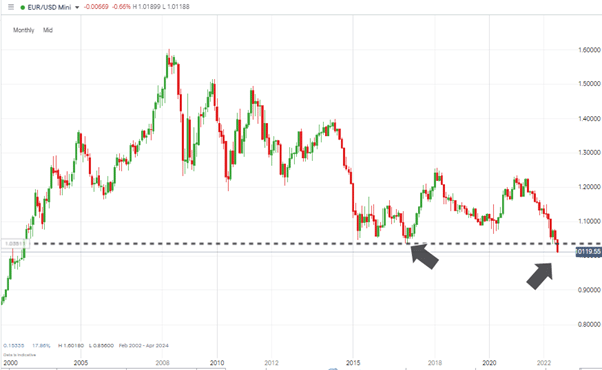
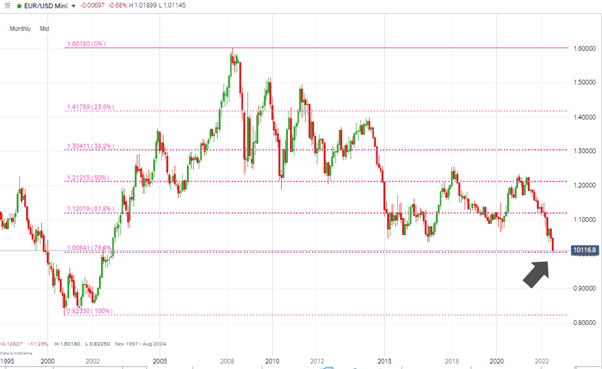
- Entry Level 1: 1.0064 – Level of the 76.4% Fibonacci Retracement dating back to the price low of 2000.
- Price Target 1: 1.0354 – Previous Year to date price low recorded on 13th May 2022
- Price Target 2: 1.04093 – Region of 20 SMA on Daily Price Chart.
- Stop Loss: < 1.0000 – Psychologically important price level. Will the euro go to parity with the dollar?
EURUSD Chart – Monthly Candles – Buying at Fib Support Level 1.00641
Source: IG
USDJPY
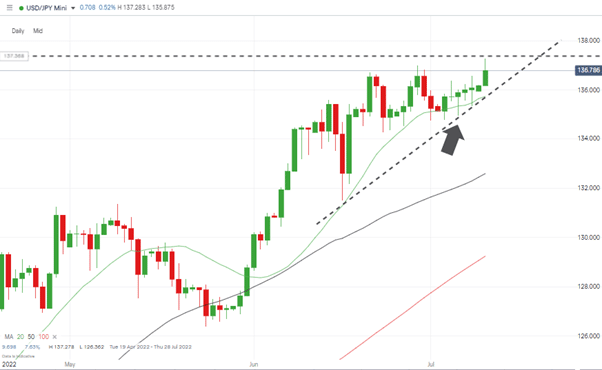
Upward momentum in the dollar-yen continues to build. Fears relating to outbreaks of Covid in Asia leading to more lockdowns have seen a widespread move into USD. As long as price remains above the 20 SMA on the Daily price chart, there is every reason to believe the current wedge pattern forming behind the recent highs points to USDJPY going through a period of consolidation rather than full reversal mode.
USDJPY – Daily Price Chart – Supporting Role of 20 SMA
Source: IG
Long positions
- Entry Level 1: 135.73 – Region of the 20 SMA on the Daily Price Chart. Applying a momentum based strategy.
- Entry Level 2: 132.59 – Region of the 50 SMA on the Daily Price Chart.
- Price Target 1: 137.27 – Year to date price high printed on 11th July 2022.
- Stop Loss: < 130.00 – Below the 50 SMA on the Daily Price Chart and the psychologically important round number price support.
Short positions
- Entry Level 1: 135.73 – Region of the 20 SMA on the Daily Price Chart. Using a break of the key metric as an indication to apply a breakout strategy.
- Price Target 1: 132.59 – Region of the 50 SMA on the Daily Price Chart.
- Stop Loss: > 137.27 – Year to date price high printed on 11th July 2022.
Indices
NASDAQ 100
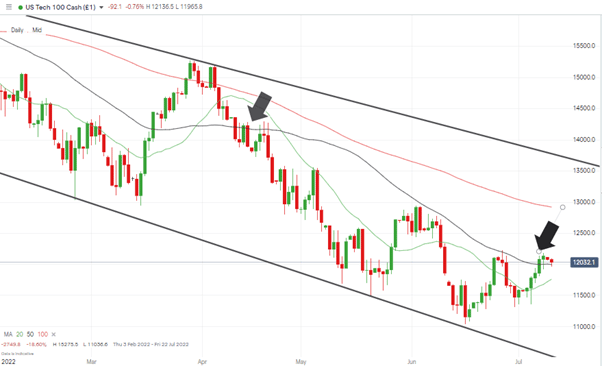
Strength in global equities last week was best represented by the Nasdaq 100 posting five up-days in a row and making a +4% gain on the week. Continued bullish sentiment relating to growth tech stocks would signal a change in mood after half a year of investors rotating into safer sectors.
The 50 SMA on the Daily Price Chart appears to be the best indicator of how far this mini rally could go and if it does signal the bottom of the market. That SMA has guided price on its downward journey, and the close above that metric on Thursday 7th July was the first time that had occurred since 13th April 2022.
NASDAQ 100 Chart – Daily Candles – 20 and 50 SMAs
Source: IG
Long positions
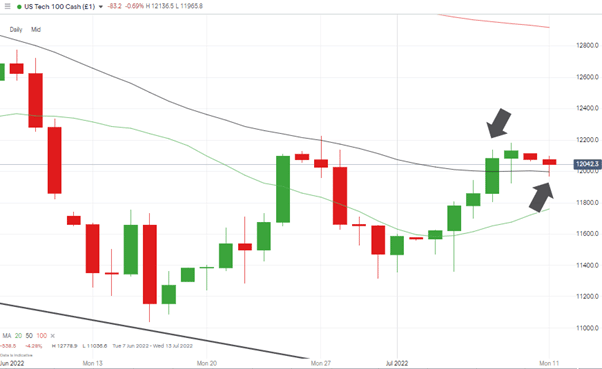
- Entry Level 1: 11,966 – Region of the 50 SMA on the Daily Price Chart and just below the psychologically important ’round number’ price level of 12,000.
- Price Target 1: 12,918 – Region of the 50 SMA on the Daily Price Chart
- Price Target 2: 13,600 – Upper end of downwards price channel dating back to January 2022.
- Stop Loss: < 11,759 – Below the 20 SMA on the Daily Price Chart.
Short positions
- Entry Level 1: 11,966 – Region of 50 SMA on Daily Price Chart
- Price Target 1: 11,759 – Region of 20 SMA on Daily Price Chart
- Stop Loss: > 12,942 – Price high of 2nd June 2022.
NASDAQ 100 Chart – Daily Candles – 20 and 50 SMAs
Source: IG
Oil
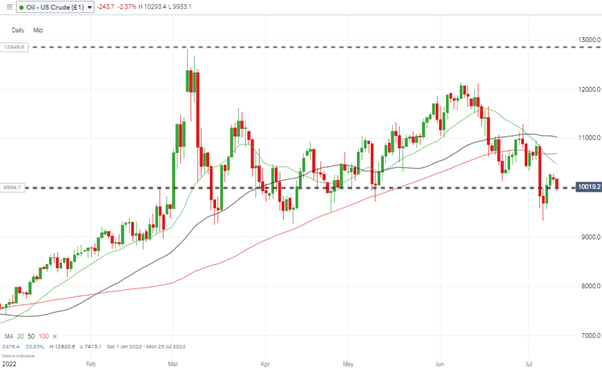
The threat of a global recession has finally brought oil’s multi-month bull run to a halt, and crude is currently trading below its 20, 50 and 100 SMAs on the Daily Price Chart. Analyst price predictions still cover an unusually wide range, with industry experts stating both $75 and $150 per barrel could come into play by the end of the year. In the short term, the focus will be on another ’round number’ price level – the all-important $100 per barrel price bar.
US Crude Oil – Weekly Candles – $100 per barrel
Source: IG
Long positions
- Entry Level 1: 100.00 – Round number support. A break below this level would signify a reversal in a multi-month trend.
- Price Target 1: 104.87 – Region of the 20 SMA on the Daily Price Chart.
- Stop Loss: < 98.84 – The 38.2% Fibonacci retracement levels of the bull run dating from December 2021 and below the psychologically important $100 price level.
Crypto – Bitcoin & Ethereum
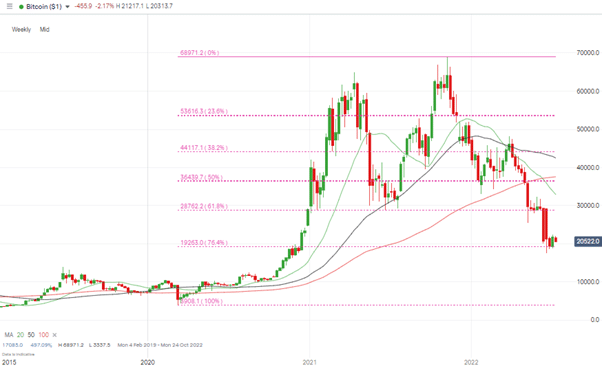
There was some relief for crypto-bulls last week, with bitcoin and ether posting respective gains of 7.33% and 18.55%. The out-performance of ETH reflects hopes that The Merge and improved Proof-of-Stake protocols may, after many delays, finally be ready to be rolled out.
Bitcoin Price Chart – Weekly Candles
Source: IG
Bitcoin Long positions
- Entry Level 1: 20,521 – Region of 20 SMA on Daily Price Chart.
- Price Target 1: 24,503 – Region of 50 SMA on Daily Price Chart.
- Stop Losses: < 19,263 – Region of the 76.4% Fibonacci retracement level dating back to March 2020. This is the last recognised Fib retracement level before a 100% fallback in price, and all of the covid-lockdown gains are given up.
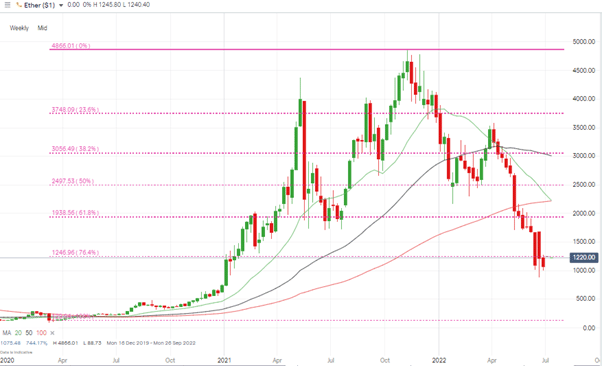
Ethereum Chart – Weekly Candles – Fib Support Levels
Source: IG
Ethereum Long positions
- Entry Level 1: 1,246.96 – Region of the 76.4% Fibonacci retracement level dating back to March 2020.
- Price Target 1: 1,457 – Region of 50 SMA on Daily Price Chart.
- Stop Losses: < 1,150 – Region of 20 SMA on Daily Price Chart.
Risk Statement: Trading financial products carries a high risk to your capital, especially trading leverage products such as CFDs. They may not be suitable for everyone. Please make sure that you fully understand the risks. You should consider whether you can afford to take the risk of losing your money.

Forextraders' Broker of the Month
BlackBull Markets is a reliable and well-respected trading platform that provides its customers with high-quality access to a wide range of asset groups. The broker is headquartered in New Zealand which explains why it has flown under the radar for a few years but it is a great broker that is now building a global following. The BlackBull Markets site is intuitive and easy to use, making it an ideal choice for beginners.