
Instrument | Price | Hourly | Daily |
EUR/USD | 1.0433 | Strong Sell | Strong Sell |
GBP/USD | 1.2119 | Strong Buy | Strong Sell |
USD/JPY | 135.46 | Buy | Strong Buy |
S&P 500 | 3,802 | Buy | Sell |
NASDAQ 100 | 11,509 | Buy | Strong Sell |
FTSE100 | 7,240 | Strong Buy | Neutral |
Gold | 1,808 | Strong Sell | Strong Sell |
Crude Oil WTI | 106.82 | Buy | Neutral |
Bitcoin | 19,055 | Strong Sell | Strong Sell |
Ethereum | 1,046 | Strong Sell | Strong Sell |
UTC 09:31
Our trading signal analysis is based on a comprehensive summary of market data. We use a range of metrics with weighting given to simple and exponential moving averages and key technical indicators.
We created this Weekly Tips section to share possible trade entry and exit points based on our technical analysis. We also have other methods to validate our trades, which we can’t publicly share, that help increase their success. All our trades include entry and at least one target price. Stop losses are applied at the reader’s discretion. Our strategies typically trade with a wide stop loss, and risk is further mitigated by trading in small sizes.
The FTSE 100 equity index, the euro-dollar currency pair, and crypto market indicators point towards short-term and long-term strengths. Trading decisions need to be made with holding periods in mind, and choppy market conditions could prevail in the run-up to the Fed’s big announcement.
FOCUS ON: Halfway Through The Year And The Playbook Remains The Same
Last week’s Trading Ideas report highlighted how, after a six-month sell-off, the markets still look willing and able to head in either direction. Uncertainty continues to run through the markets, so that guidance remains the same.
The run in to the end of June and the start of July was associated with another rout of risk on asset groups, with GBPUSD and EURUSD both losing more than 1% over the week. Equity indices, such as the S&P 500 and Nasdaq 100, lost between 3 – 5.5% in value and posted their worst first-half-of-the-year performance since 1970.
Price moves in the market continue to be dominated by fears surrounding inflation, recession, and tightening monetary policy. Those with a bullish weighting may be right that this is a case of markets overshooting to the downside, but there appears to be little reason to think that trend is likely to turn in the immediate future.
The US national holiday on 4th July can be expected to be marked by lower trading volumes but big fundamental analysis based news releases later in the coming week look set to raise the tempo once more. On Wednesday, market analysts will release the minutes of the latest FOMC meeting to be digested. Thursday marks the day when German Industrial Production and Halifax House Price Index (UK) numbers will be shared, and on Friday, US jobless numbers for June will be released.
The Non-Farm Payrolls number is always one of the month’s most eagerly awaited data points. With central banks prioritising controlling inflation rather than economic growth, a high NFP number could signal the US economy moving towards a state of stagflation.
Forex
GBPUSD
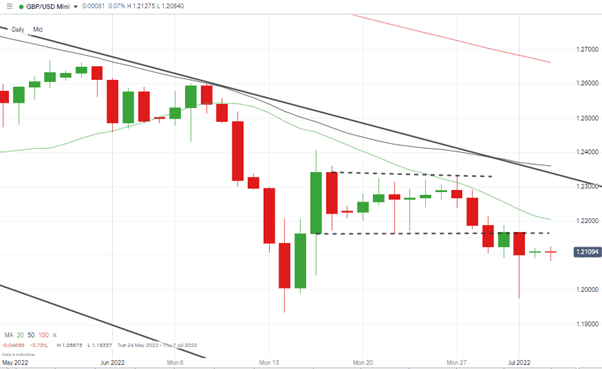
The doji pattern formed during the week beginning 20th June finally broke on Wednesday 29th with the price of GBPUSD once again moving to the downside. With price continuing to trade below the 20, 50, and 100 SMAs on the Daily Price Chart, the path of least resistance continues to appear to be downward.
GBPUSD Chart – Daily Candles – Doji Candles and Downside Break
Source: IG
From a local perspective, the Halifax House Price Index numbers due on Thursday 7th July will offer an insight into the health of the all-important UK housing market. Talk of a possible housing price crash has increased lately and would be bad news for consumer confidence.
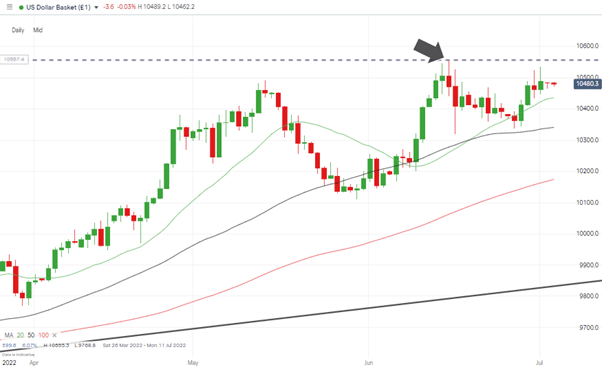
US Dollar Basket Index Price Chart – Daily Candles – Doji Candles and Downside Break
Source: IG
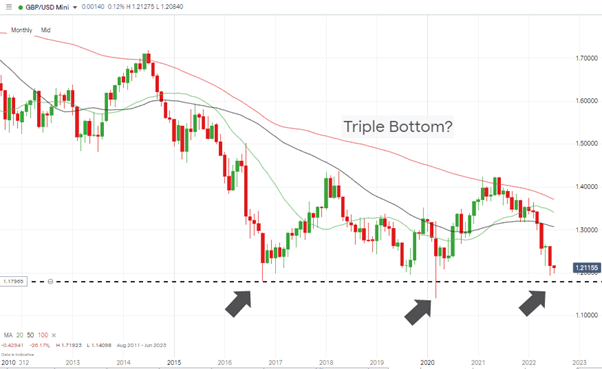
Events in the UK economy only partly answer the question of how low the GBP can go. The bottom of the market is more likely to be set by the US dollar index, which needs to break the year-to-date high of 105.55 (15th June) to signal it is continuing its possibly overextended upward trend.
GBPUSD Chart – Monthly Candles – Triple-Bottom?
Source: IG
Short positions
- Entry Level 1: 1.2204 – Selling into strength at the point where the 20 SMA and psychologically important price level of 1.22 converge.
- Price Target 1: 1.19337 – Price low of 14th June 2022.
- Stop Loss: > 1.24069 – Price high of Thursday 16th June 2020 and above the long-term trend line.
Long positions
- Entry Level 1: 1.19758 – Price low of Friday 1st July. The intraday rebound above the 1.20 price level suggests significant support is to be found around the 1.20 round number price level.
- Price Target 1: 1.23074 – Region of the upper trendline of the downward price channel.
- Stop Loss: < 1.19337 – year-to-date price low of 14th June 2022.
EURUSD
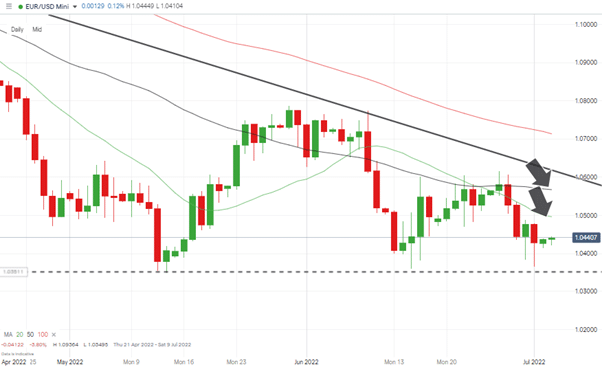
Strength in the euro-dollar following the 15th June price-low finally came unstuck last week when price clipped the 20 and 50 SMAs on the Daily Price chart. This sell-off after the currency became overextended was by no means guaranteed but was one scenario flagged up in the Trading Ideas report of 27th June.
Eurozone news releases are thin on the ground in the coming week, but the German Industrial Production numbers due on Wednesday will be eagerly awaited. Greater significance will be given to any news relating to the Ukraine-Russia conflict, which continues to be the catalyst with the most potential to determine the direction of the next move.
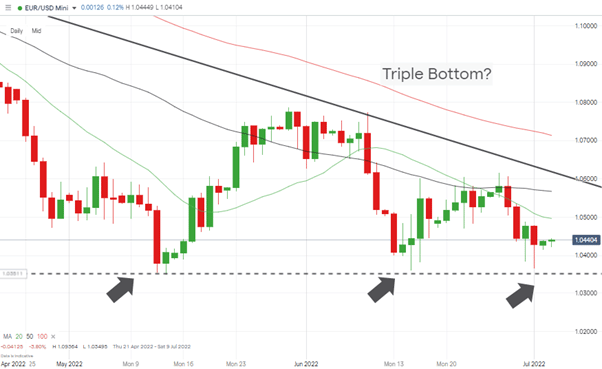
Despite the bearish undertones, taking long positions can’t be ruled out if price reaches the year-to-date lows and the region where a triple-bottom price pattern is forming on the Daily Price Chart. Price targets on those trades are set at conservative levels reflecting that although a bounce is likely, it would very possibly be short-lived.
EURUSD Chart – Daily Candles – SMAs as Trade Entry Points
Source: IG
Short positions
- Entry Level 1: 1.04962 – Region of 20 SMA on Daily Price Chart.
- Entry Level 2: 1.05672 – Region of 27th June price high and 20 SMA on Daily Price Chart.
- Price Target 1: 1.0354 – Year to date price low recorded on 13th May 2022 and region of potential triple-bottom.
- Stop Loss: > 1.0774 – Price high of 9th June 2022.
Long positions
- Entry Level 1: 1.03516 – Region of potential triple-bottom forming on the Daily Price Chart.
- Price Target 1: 1.0748 – 1.04962 – Region of 20 SMA on Daily Price Chart.
- Price Target 2: 1.05672 – Region of 20 SMA on Daily Price Chart.
- Stop Loss: < 1.034 – Year to date price low recorded on 13th May 2022.
EURUSD Chart – Daily Candles – Triple Bottom?
Source: IG
USDJPY
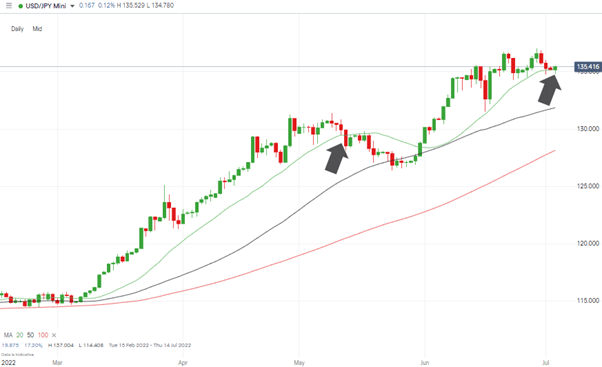
The yen fared better than GBP and EUR last week thanks to its role as a safe-haven asset. The USDJPY price chart is now marked by sideways trading, which reflects both currencies are in increased demand due to fears over the global economy tipping over into a state of stagflation.
The 20 SMA on the Daily Price Chart is the indicator to watch, thanks to slight price weakness over the last few trading sessions taking the live price down to that level. The previous time price broke through that metric to the downside was 12th May 2022, so a cut through an indicator which has guided price for more than one month would be a significant move.
USDJPY – Daily Price Chart – Supporting Role of 20 SMA
Source: IG
Long positions
- Entry Level 1: 135.19 – Region of the 20 SMA on the Daily Price Chart.
- Entry Level 2: 131.84 – Region of the 50 SMA on the Daily Price Chart.
- Price Target 1: 137.004 – Year to date price high printed on 29th June 2022 and ’round number’ price level.
- Stop Loss: < 130.00 – Below the 50 SMA on the Daily Price Chart and the psychologically important round number price support.
Short positions
- Entry Level 1: 135.19 – Region of the 20 SMA on the Daily Price Chart. Using a break of the key metric as an indication to apply a breakout strategy.
- Price Target 1: 131.84 – Region of the 50 SMA on the Daily Price Chart.
- Stop Loss: > 137.004 – Year to date price high printed on 29th June 2022 and ’round number’ price level.
Indices
NASDAQ 100
As with the forex markets, stock valuations could tip either way soon, and the imminent arrival of the US earnings season is already causing jitters in the market.
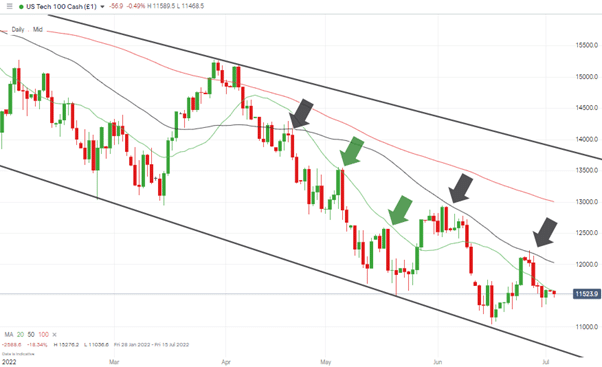
A short-term bounce in stock prices can’t be discounted, but if any major corporations release weak figures, it looks like traders will be faced with the question of which SMA to select to enter into more short trading. On the Daily Price Chart, the 20 and 50 SMAs have proved reliable metrics for those looking to enter trades that profit from further falls in stock prices.
NASDAQ 100 Chart – Daily Candles – 20 and 50 SMAs
Source: IG
Short positions
- Entry Level 1: 12,025 – Region of 50 SMA on Daily Price Chart
- Price Target 1: 11,578 – Region of 20 SMA on Daily Price Chart
- Stop Loss: > 12,942 – Price high of 2nd June 2022.
Oil
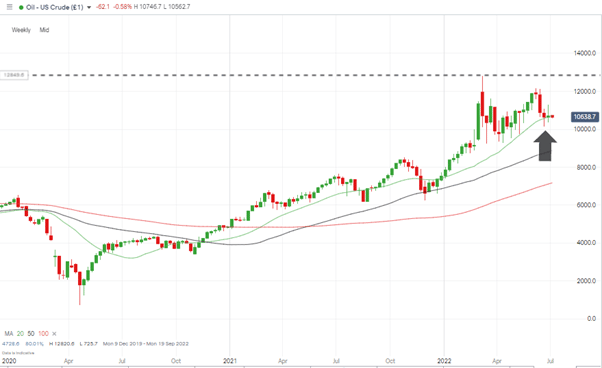
The threat of a global recession continues to hang over the price of oil, but with geopolitical uncertainty firmly in play, many will see the recent pullback as a chance to buy a dip. Price now sits on the 20 SMA on the Weekly Price Chart, which since the beginning of the year has been a profitable trade entry point for buyers.
US Crude Oil – Weekly Candles – 20 SMA
Source: IG
Long positions
- Entry Level 1: 107.17 – Region of the 20 SMA on the Weekly Price Chart.
- Price Target 1: 128.20 – Price high of 6th March 2022.
- Stop Loss: < 98.84 – 38.2% Fibonacci retracement levels of the bull run dating from December 2021 and below the psychologically important $100 price level.
Crypto – Bitcoin & Ethereum
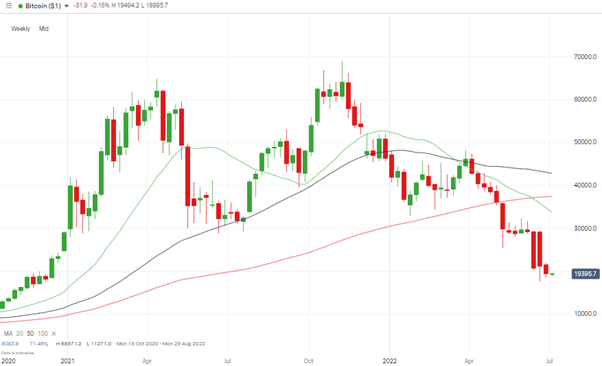
The mood surrounding Bitcoin and Ethereum continues to worsen. Bitcoin is back trading below the psychologically important $20,000 level, and Ether is struggling to trade above the crucial $1,000 price bar. The year-to-date decline for both coins points to the current bearish trend being firmly entrenched, with even die-hard fans deciding to sell up at current levels.
Bitcoin Price Chart – Weekly Candles
Source: IG
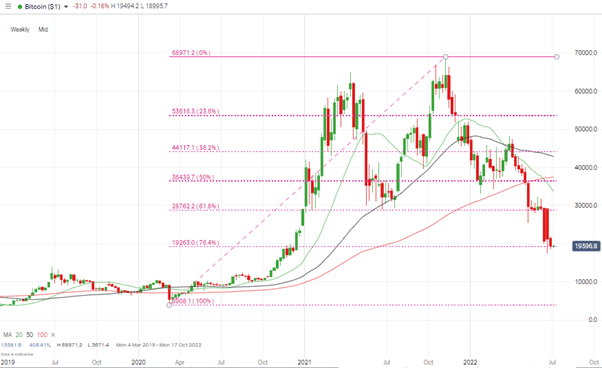
Bitcoin Long positions
- Entry Level 1: 19,263 – Region of the 76.4% Fibonacci retracement level dating back to March 2020. This is the last recognised Fib retracement level before a 100% fallback in price, and all of the covid-lockdown gains are given up.
- Price Target 1: 20,347 – Region of 20 SMA on Daily Price Chart.
- Price Target 2: 25,704 – Region of the 50 SMA on the Daily Price Chart.
- Stop Losses: < 17,604 – 2022 year-to-date low.
Bitcoin Chart – Weekly Candles – Fib Support Levels
Source: IG
Risk Statement: Trading financial products carries a high risk to your capital, especially trading leverage products such as CFDs. They may not be suitable for everyone. Please make sure that you fully understand the risks. You should consider whether you can afford to risk losing your money.

Forextraders' Broker of the Month
BlackBull Markets is a reliable and well-respected trading platform that provides its customers with high-quality access to a wide range of asset groups. The broker is headquartered in New Zealand which explains why it has flown under the radar for a few years but it is a great broker that is now building a global following. The BlackBull Markets site is intuitive and easy to use, making it an ideal choice for beginners.