Instrument | Price | Hourly | Daily |
EUR/USD | 1.0577 | Strong Buy | Neutral |
GBP/USD | 1.2325 | Strong Buy | Neutral |
USD/JPY | 135.01 | Buy | Strong Buy |
S&P 500 | 3,930 | Strong Buy | Neutral |
NASDAQ 100 | 12,177 | Strong Buy | Buy |
FTSE100 | 7,261 | Strong Buy | Sell |
Gold | 1,837 | Strong Buy | Strong Sell |
Crude Oil WTI | 106.96 | Strong Buy | Sell |
Bitcoin | 21,320 | Neutral | Sell |
Ethereum | 1,229 | Neutral | Strong Sell |
UTC 09:28
Our trading signal analysis is based on a comprehensive summary of market data. We use a range of metrics with weighting given to simple and exponential moving averages and key technical indicators.
We created this Weekly Tips section to share possible trade entry and exit points based on our technical analysis. We also have other methods to validate our trades that we can’t publicly share that help to increase their success. All our trades include entry and at least one target price. Stop losses are applied at the reader’s discretion. Our strategies typically trade with a wide stop loss, and risk is further mitigated by trading in small size
The FTSE 100 equity index, the euro-dollar currency pair, and crypto market indicators are all pointing towards short-term strength and long-term weakness. Trading decisions need to be made with holding periods in mind and choppy market conditions could prevail in the run-up to the Fed’s big announcement.
FOCUS ON: Continued Uncertainty Leaves All Options Open
The degree of price stability that marked last week’s forex trading leaves traders facing a stick-or-twist scenario. The slight rally in EURUSD and GBPUSD resulted in those major pairs ending up on the week by 0.45% and 0.71%, respectively. This isn’t the first time that a relief rally has formed a retracement leg on an otherwise long-term bearish price pattern and does little to point to the sell-off being over or still only half-done.
Caution is needed and technical indicators leave room for forex, equities, commodities and crypto to move in either direction. Sideways movement could well dominate the early part of the week. The doji candles on the Daily Price Chart for GBPUSD have set up a situation where range-trading strategies may be the order of the day – a scenario made more likely by the fact that in a week of relatively light news flow, most eyes will be on the US Non-Farm Payroll jobs numbers, which don’t come out until Friday 8th July.
The rally in stocks in the second half of last week has brought major indices to an interesting price gap on the Weekly Price Chart. That gap could well draw price higher, but whether closing it represents the end of the bear market, or just the tidying up of unfinished business, remains to be seen.
Oil traders will have Thursday 30th June marked down in their calendar. After weeks of technical analysis metrics driving price upwards, the meeting of OPEC+ on Thursday offers a chance for fundamental analysis-orientated price drivers to come into play. Over the weekend, analysts from Bank of America suggested that crude prices could drop to $75 per barrel in a recession or jump as high as $150 if EU sanctions cut off Russian supply.
GBPUSD Chart – Daily Candles – Doji Candles and Range-bound Trading
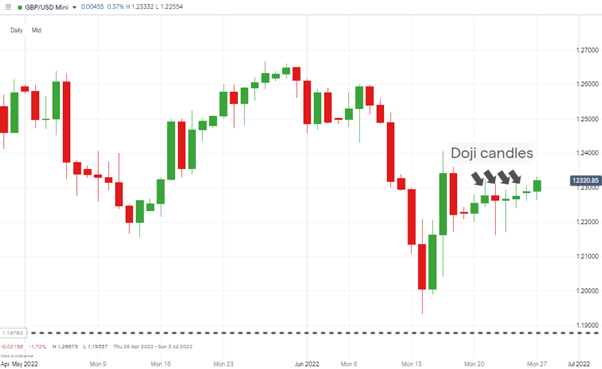
Source: IG
Forex
GBPUSD
Price volatility drained out of GBPUSD last week. As a result, none of the price entry points identified in the Weekly Trading Ideas report were triggered. This might not have been a bad thing as the market then, and now, continues to offer few clues on whether the next substantial move will be upwards or downwards.
Applying scalping-based trading strategies could continue to be the best approach, particularly with the US jobs numbers looming on Friday 8th July. Before that, the major cable-related news release of this week is the confirmation of the UK Q1 GDP number due out on Thursday 30th June.
GBPUSD Chart – Daily Candles – February-June 2022
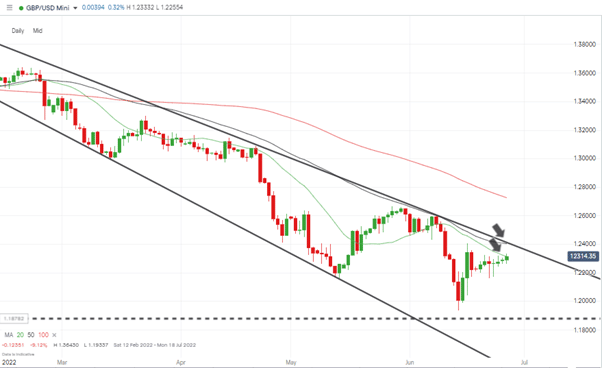
Source: IG
Further upward price movement will face stiff resistance from the combination of the 50 SMA on the Daily Price Chart and upper trendline of the downward price channel, both of those currently sitting in the region of 1.240.
A longer timeframe suggests that a triple bottom pattern could be forming on the Monthly Price Chart, which points to significant support for price in the region of 1.20.
GBPUSD Chart – Monthly Candles – Triple Bottom
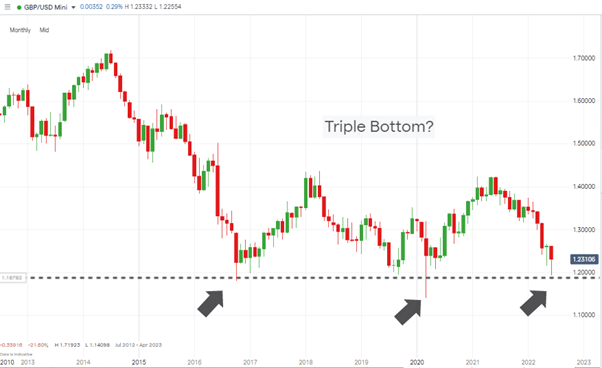
Source: IG
Short positions
- Entry Level 1: 1.240 – Selling into strength at the point where the 50 SMA on the Daily Price Chart and upper trendline of the downward price channel converge.
- Price Target 1: 1.2000 – Psychologically important ‘round number’ price level.
- Price Target 2: 1.19337 – Price low of 14th June 2022.
- Stop Loss Option 1: > 1.24069 – Price high of Thursday 16th June 2020 and above the long-term trendline.
Long positions
- Entry Level 1: 1.23145 – Price has started the week above the 20 SMA on the Daily Price Chart, opening the door to long GBPUSD positions using that metric as a support level.
- Price Target 1: 1.240 – Round number price level and region of the 50 SMA on the Daily Price Chart.
- Stop Loss: < 1.20 – ‘Round number’ and psychologically important support level.
EURUSD
Strength in euro-dollar since 15th June has resulted in a 2.0% price rise. With price currently in the region of the 20 and 50 SMAs on the Daily Price Chart, the question is whether that rally will continue and use those metrics as support, or retreat to the region of 1.036.
Euro-based news is in short supply this week, meaning that the technical indicators look set to dominate price moves. A break upwards that took price above 1.0787 would signal a double bottom pattern forming on the Daily Price Chart and increase the rating given to price support found in the region of 1.03476.
EURUSD Chart – Daily Candles – SMAs and Double Bottom?
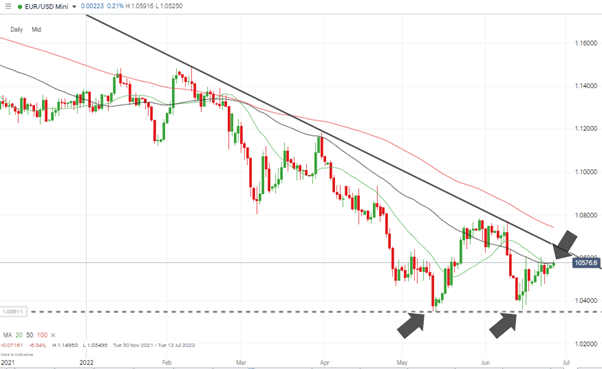
Source: IG
Short positions
- Entry Level 1: 1.05779 – Region of the 50 SMA on the Daily Price Chart.
- Entry Level 2: 1.0650 – Region of upper trendline of long-time downward price channel.
- Price Target 1: 1.0354 – Year-to-date price low recorded on 13th May 2022.
- Stop Loss: > 1.0774 – High of 9th June 2022.
Long positions
- Entry Level 1: 1.05779 – Region of the 50 SMA on the Daily Price Chart.
- Entry Level 2: 1.0650 – Region of upper trendline of long-time downward price channel. Using a breakout strategy approach.
- Price Target 1: 1.0748 – Region of the 100 SMA on the Daily Price Chart.
- Stop Loss: < 1.034 – Year-to-date price low recorded on 13th May 2022.
EURUSD Chart – Daily Candles
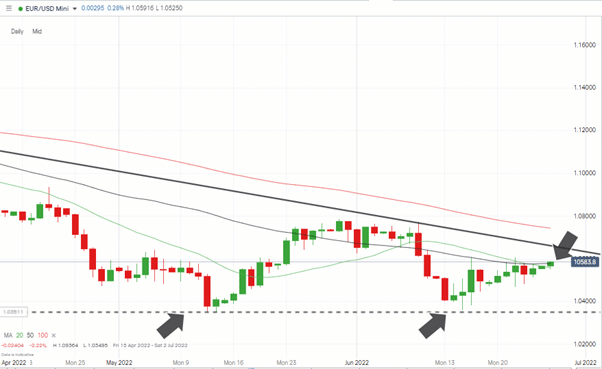
Source: IG
USDJPY
The dollar-yen upward trend remains intact despite last week being marked by sideways trading and price consolidation. This has given the 20 SMA on the Daily Price Chart time to catch up with live prices, which will offer a convenient trade entry point for those looking to go long USDJPY.
A pullback to the 50 SMA can’t be ruled out. Price fell back to be in line with that SMA as recently as 31st May 2022, so those bullish on the currency pair will have to decide whether to apply patience or not.
USDJPY Chart – 1-Day Candles
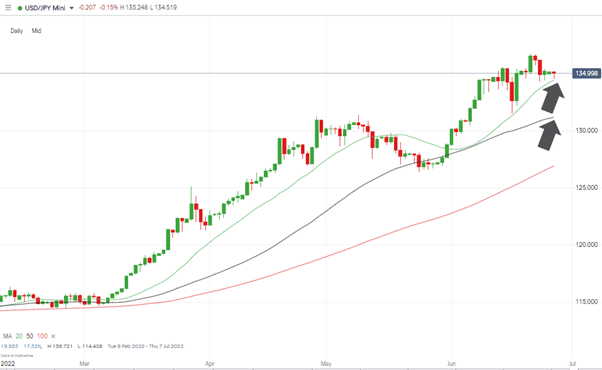
Source: IG
Long positions
- Entry Level 1: 134.40 – Region of the 20 SMA on the Daily Price Chart.
- Entry Level 1: 131.16 – Region of the 50 SMA on the Daily Price Chart.
- Price Target 1: 136.72 – Year-to-date price high printed on 21st June 2022.
- Stop Loss: < 130.00 – Below the 50 SMA on the Daily Price Chart and the psychologically important round number price support.
Indices
NASDAQ 100
As with the forex markets, stock valuations could tip either way in the near future. The long-term slide has been driven by central banks scaling back on the liquidity that propped up the markets for so long, but relief rallies, or even a major turn in direction, can’t be ruled out.
The Nasdaq 100 index has suffered more than most as growth stocks have fallen out of favour and now sits between two key Fibonacci price levels. On a monthly price chart, the May and June candles look set to close between the 38.2% and 50% retracement levels based on the bull run from March 2020. Intra-month prices have ventured out of this range, but a monthly close above or below those Fibs would offer a clearer guide on the direction of the next move.
NASDAQ 100 Chart – Monthly Candles – Fib Levels Coming Into Play
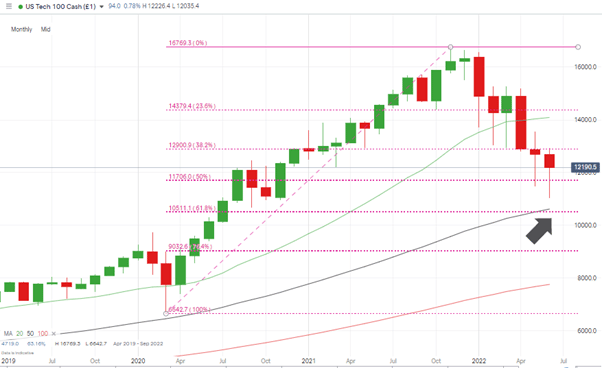
Source: IG
Long positions
- Entry Level 1: 11,842 – Buying into any pullback in the region of the 50 SMA on the Daily Price Chart.
- Entry Level 2: 12,201 – Region of the 20 SMA on the Daily Price Chart.
- Price Target 1: 13,142 – Region of the 100 SMA on the Daily Price Chart.
- Stop Loss: < 10,850 – Below supporting trendline and 11,000 ‘round number’ price level.
Short positions
- Entry Level 1: 12,201 – Region of the 20 SMA on the Daily Price Chart.
- Price Target 1: 11,842 – Region of the 50 SMA on the Daily Price Chart.
- Stop Loss: > 12,942 – Price high of 2nd July 2022.
Oil
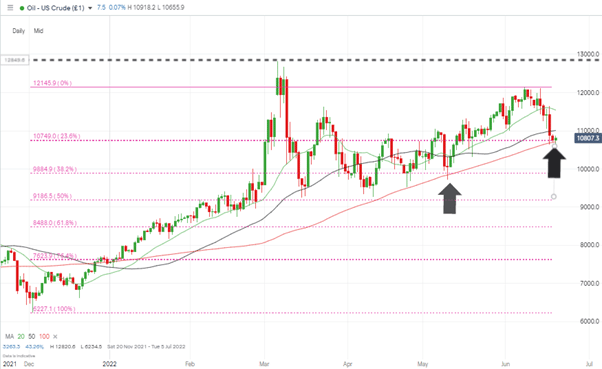
A pullback in oil prices was always likely considering how long the current bull run has been in place, but the break of the 100 SMA on the Daily Price Chart raises significant questions for those looking to go long. This could be another dip to buy, but the last time the price of crude closed below that metric was 31st December 2021.
The reaction of traders to a breach of the 100 SMA being confirmed for the first time this year will be coloured by events on Thursday when OPEC+ meet to discuss supply plans. The conflict in Ukraine also looms over the price, with Bank of America offering a price range of $75-$150 depending on how that situation pans out.
US Crude Oil – 1-Day Candles – 100 SMA & Fib Support
Source: IG
Long positions
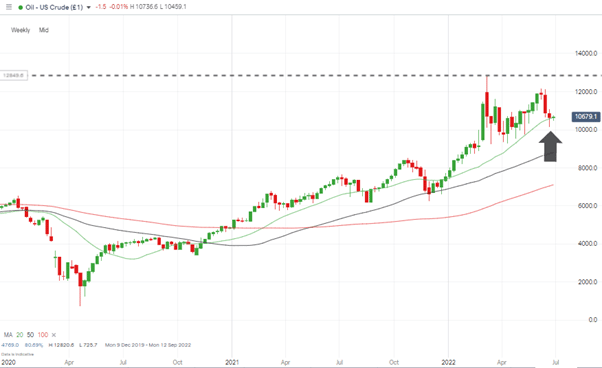
- Entry Level 1: 106.370 – Region of the 20 SMA on the Weekly Price Chart.
- Price Target 1: 128.20 – Price high of 6th March 2022.
- Stop Loss: < 98.84 – 38.2% Fibonacci retracement levels of the bull run dating from December 2021 and below psychologically important $100 price level.
US Crude Oil – Weekly Candles – SMA
Source: IG
Crypto – Bitcoin & Ethereum
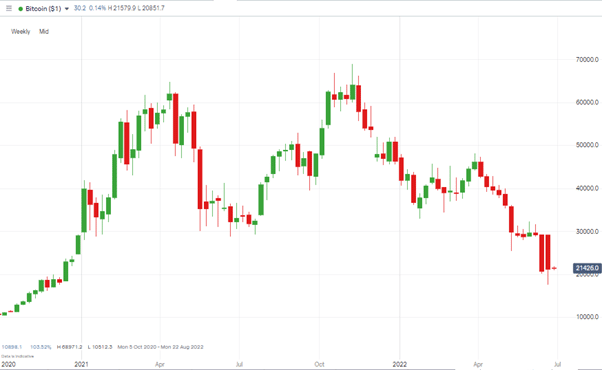
Some stability returned to the crypto markets last week. The collapse of Luna and news that Coinbase was laying off 18% of its workforce appear to be working through the system.
Bitcoin Price Chart – Weekly Candles
Source: IG
Bitcoin long positions
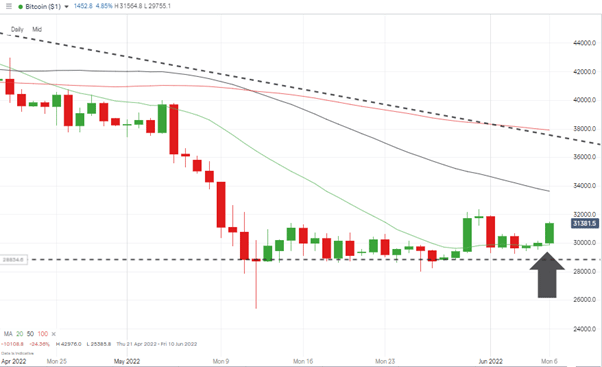
- Entry Level 1: 20,000 – Buying into weakness and using the psychologically important 20k price level as support.
- Price Target 1: 23,001 – Region of the 20 SMA on the Daily Price Chart.
- Price Target 2: 27,191 – Region of the 500 SMA on the Daily Price Chart.
- Stop Losses: < 17,604 – 2022 year-to-date low.
Bitcoin Chart – 1-Day Candles – 20 SMA support
Source: IG
Ethereum Chart – Weekly Candles
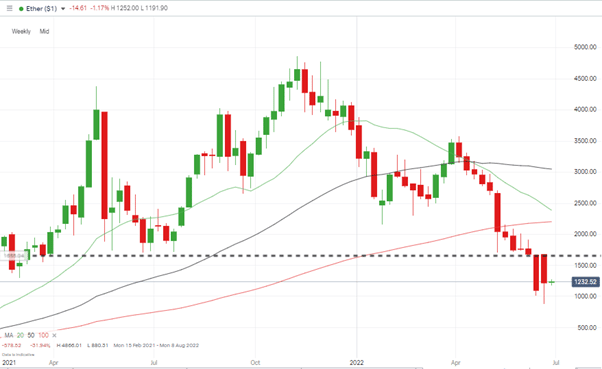
Source: IG
Ethereum long positions
- Entry Level 1: 1,000 – Psychologically important price level. Tested by last week’s price drop to $880, but ETH has scrambled back above that key level that will now offer support.
- Price Target 1: 1,681 – Region of the 50 SMA on the Daily Price Chart.
- Price Target 2: 2,370 – In extension – region of the 100 SMA on the Daily Price Chart.
- Stop Losses: < 880 – 2022 year-to-date low.
Risk Statement: Trading financial products carries a high risk to your capital, especially trading leverage products such as CFDs. They may not be suitable for everyone. Please make sure that you fully understand the risks. You should consider whether you can afford to take the risk of losing your money.

Forextraders' Broker of the Month
BlackBull Markets is a reliable and well-respected trading platform that provides its customers with high-quality access to a wide range of asset groups. The broker is headquartered in New Zealand which explains why it has flown under the radar for a few years but it is a great broker that is now building a global following. The BlackBull Markets site is intuitive and easy to use, making it an ideal choice for beginners.