
Instrument | Price | Hourly | Daily |
EUR/USD | 1.0138 | Strong Buy | Strong Sell |
GBP/USD | 1.1932 | Strong Buy | Strong Sell |
USD/JPY | 138.07 | Strong Sell | Strong Buy |
S&P 500 | 3,895 | Strong Buy | Neutral |
NASDAQ 100 | 12,127 | Strong Buy | Neutral |
FTSE100 | 7,254 | Strong Buy | Buy |
Gold | 1,717 | Strong Buy | Strong Sell |
Crude Oil WTI | 97.17 | Strong Buy | Strong Sell |
Bitcoin | 20,887 | Strong Buy | Strong Buy |
Ethereum | 1,255 | Strong Buy | Strong Buy |
UTC 09:44
Our trading signal analysis is based on a comprehensive summary of market data. We use a range of metrics with weighting given to simple and exponential moving averages and key technical indicators.
We created this Weekly Tips section to share possible trade entry and exit points based on our technical analysis. We also have other methods to validate our trades which we can’t publicly share that help to increase their success. All our trades include entry and at least one target price. Stop losses are applied at the reader’s discretion. Our strategies typically trade with a wide stop loss, and risk is further mitigated by trading in small sizes.
The FTSE 100 equity index, the euro-dollar currency pair, and crypto market indicators are all pointing towards short-term strength and long-term weakness. Trading decisions need to be made with holding periods in mind, and choppy market conditions could prevail in the run-up to the Fed’s big announcement.
FOCUS ON: Rebound into Risk?
Few would be willing to dismiss the idea of the long-term bearish momentum continuing into the end of the year. However, with forex and stock markets reaching important support and resistance levels, the markets could be set for a short-term bounce.
Last week’s Technical Analysis and Trading Ideas Report identified a divergence between forex and stock markets. The outperformance in equities continued into the close of Friday 15th July, and it looks like forex markets could be beginning to follow the move into embracing risk, at least in the short term.
Euro-dollar was the big talking point of the week, with the currency pair at one point trading below parity. The low of 0.99522 printed on Thursday 14th July now marks the lowest price point since November 2022. If that move to such a critical psychological level was just a handshake to prove it had got there, then long EURUSD positions set with stop losses below 0.99522 could be profitable short-term trades.
Weakness in the oil price could also influence prices in other asset classes. If crude remains below $100 per barrel, then inflationary and recessionary concerns will, to some extent, be reduced. Another wildcard to factor in is the US earnings season, and any signs that consumer spending is holding up despite the economic turmoil could be regarded as a catalyst for those looking to go long into markets that are oversold on some timescales.
US Dollar Basket Chart – Daily Candles – Consolidation or a Dip to Buy?
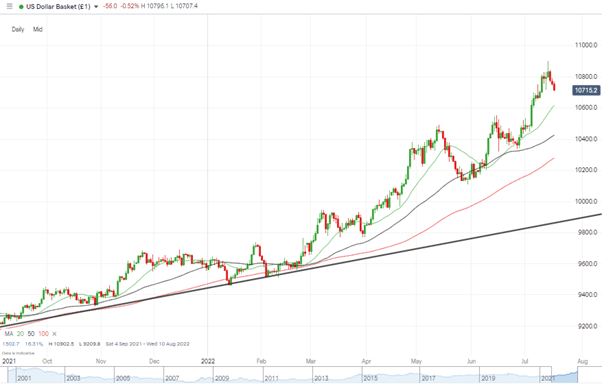
Source: IG
Key Economic Events for the Week Beginning 18/07/2022
Tuesday
- Reserve Bank of Australia Monetary Policy Meeting Minutes
- Bank of England governor Bailey Speaks
Wednesday
- Reserve Bank of Australia Gov Lowe Speaks
- UK Inflation (CPI)
- Canada Inflation (CPI)
- US Existing Home Sales
Thursday
- Bank of Japan Interest Rate Decision
- ECB Main Refinancing Rate Decision, Monetary Policy Statement, and Press Conference
Friday
- UK Retail Sales
- French, German, Eurozone, UK, and US Flash Services and Manufacturing PMIs
Forex
GBPUSD
Cable spent the first part of last week following the long-term bearish price pattern that has marked the first half of 2022. Strength in the run-in to the week’s close appears to have been caused by technical rather than fundamental factors. In a quiet news week, the Daily RSI clipped 30; that signal that the market could be oversold was followed by a three-day rally.
GBPUSD Chart – Daily Candles – Short-term Trendline
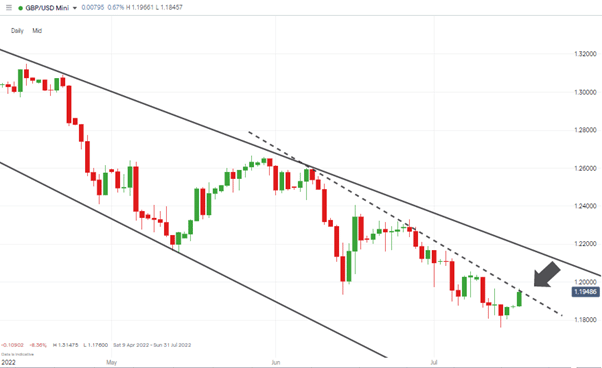
Source: IG
Price is now testing the resistance line, which dates back to the 8th June. Further upward movement and a breach of 1.196 could open the way to a forming of a breakout price pattern.
GBPUSD Chart – Daily Candles – RSI <30
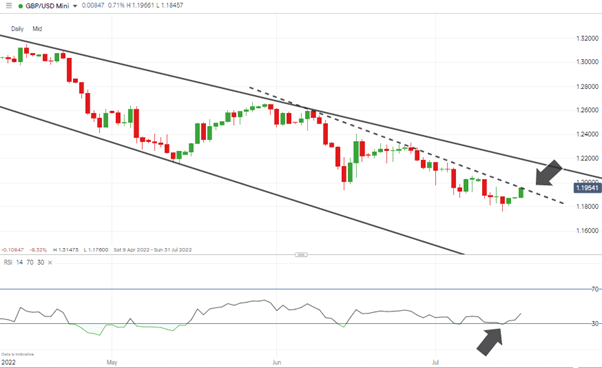
Source: IG
Short positions
- Entry Level 1: 1.19657 – Region of (dotted) resistance trendline.
- Price Target 1: 1.176 – year-to-date price low of 14th July 2022.
- Stop Loss: > 1.23327 – Price high of Thursday 27th June 2022 and above the long-term trend line.
Long positions
- Entry Level 1: 1.19657 – Region of (dotted) resistance trendline.
- Price Target 1: 1.21857 – Region of the upper trendline of the multi-month downward price channel.
- Stop Loss: < 1.176 – year-to-date price low of 14th July 2022.
EURUSD
The ECB takes its turn to make an interest rate announcement on Thursday, 21st July 2022. While other central banks have posted rate hikes of 75 and 100 basis points, the market is still expecting eurozone rates to go up by only 0.25%. That move, whilst small in number terms, is psychologically significant because it would be the first ECB interest rate rise in more than ten years.
The situation in Ukraine and concerns about the security of energy supplies from Russia continue to cast a shadow over EURUSD prices.
EURUSD Chart – Daily Candles – Bounce Back Above Parity
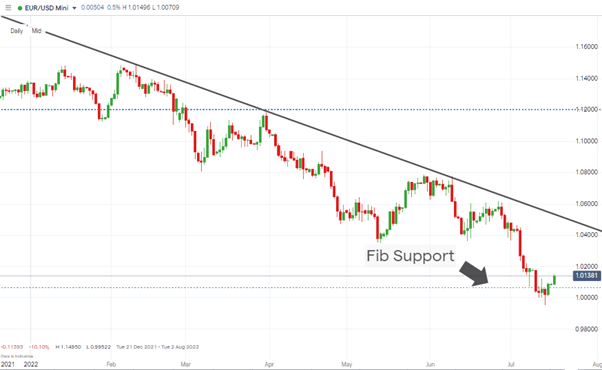
Source: IG
Short positions
- Entry Level 1: 1.02663 – Region of the 20 SMA on the Daily Price Chart.
- Price Target 1: 0.99522 – Year to date price low recorded on 14th July 2022 and region of potential triple-bottom on the Monthly Price Chart.
- Stop Loss: > 1.04769 – Region of the 50 SMA on Daily Price Chart and the upper trendline of the long-term downward price channel.
Long positions
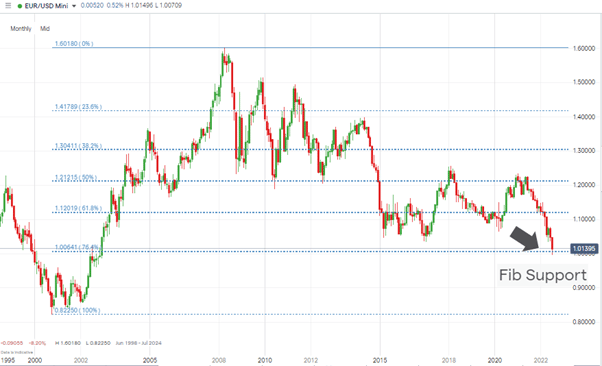
- Entry Level 1: 1.0064 – Level of the 76.4% Fibonacci Retracement dating back to the price low of 2000.
- Price Target 1: 1.02663 – Region of 20 SMA on Daily Price Chart.
- Price Target 2: 1.0354 – Previous Year to date price low recorded on 13th May 2022
- Stop Loss: < 1.0000 – Psychologically important price level.
EURUSD Chart – Monthly Candles – Buying at Fib Support Level 1.00641
Source: IG
USDJPY
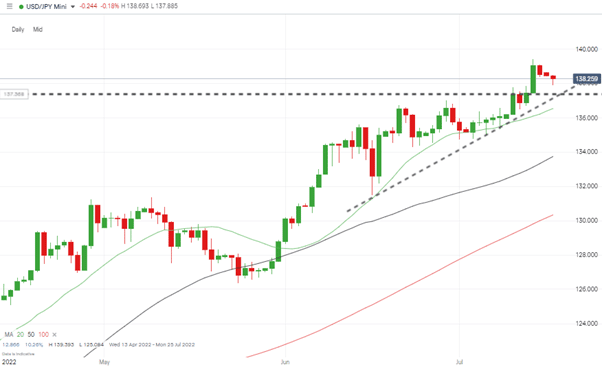
Dollar-yen continues to press north. The wedge pattern highlighted last week was broken on Thursday, and 137.43 now represents another support level for USDJPY. Price is still trading above the 20 SMA on the Daily Price Chart and the supporting trend line that dates back to 16th June.
The Bank of Japan will, on Thursday 21st July, update the markets on its interest rate policy and without a substantial surprise from the BoJ, the path of least resistance continues to appear upward.
USDJPY – Daily Price Chart – Break Through of Wedge Pattern
Source: IG
Long positions
- Entry Level 1: 136.53 – Region of the 20 SMA on the Daily Price Chart. Applying a momentum-based strategy.
- Entry Level 2: 133.74 – Region of the 50 SMA on the Daily Price Chart.
- Price Target 1: 139.39 – Year to date price high printed on 14th July 2022. Below the psychologically important price level of 140.00, which can be expected to offer resistance.
- Stop Loss: < 130.00 – Below the 50 SMA on the Daily Price Chart and the psychologically important round number price support.
Short positions
- Entry Level 1: 139.39 – Year to date price high of 14th July and region of the 140.00 price bar, which can be expected to offer stiff resistance.
- Price Target 1: 136.53 – Region of the 20 SMA on the Daily Price Chart
- Price Target 2: 133.74 – Region of the 50 SMA on the Daily Price Chart.
- Stop Loss: > 140.00 – Round number price level.
Indices
NASDAQ 100
Strength in global equities has coincided with the start of the earnings season. The long-term outlook might remain bearish, but a retracement rally can’t be discounted with the quarterly updates from big corporations having a track record of acting as a catalyst for price moves.
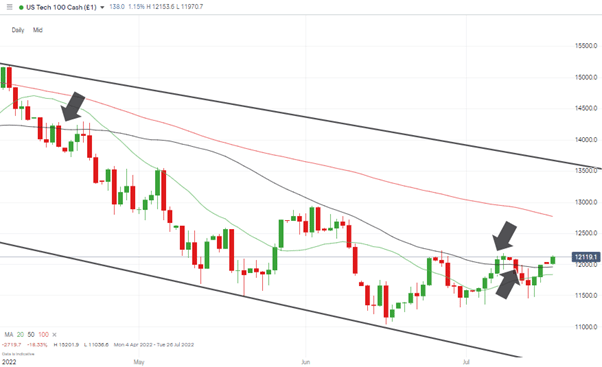
While price continues to hold above the 50 SMA on the Daily Price Chart, there is every chance of a break to the upside.
NASDAQ 100 Chart – Daily Candles – 20 and 50 SMAs
Source: IG
Long positions
- Entry Level 1: 11,961 – Region of the 50 SMA on the Daily Price Chart and just below the psychologically important ’round number’ price level of 12,000.
- Price Target 1: 12,771 – Region of the 100 SMA on the Daily Price Chart
- Price Target 2: 13,500 – Upper end of downwards price channel dating back to January 2022.
- Stop Loss: < 11,759 – Below the 20 SMA on the Daily Price Chart.
Short positions
- Entry Level 1: 11,961 – Region of 50 SMA on Daily Price Chart
- Price Target 1: 11,838 – Region of 20 SMA on Daily Price Chart
- Stop Loss: > 12,942 – Price high of 2nd June 2022 and region of the 100 SMA on the Daily Price Chart.
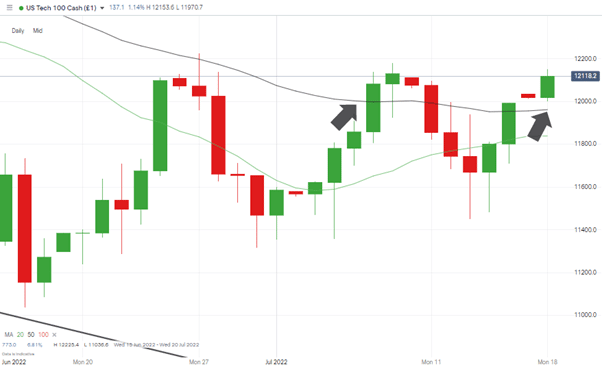
NASDAQ 100 Chart – Daily Candles – 20 and 50 SMAs
Source: IG
Oil
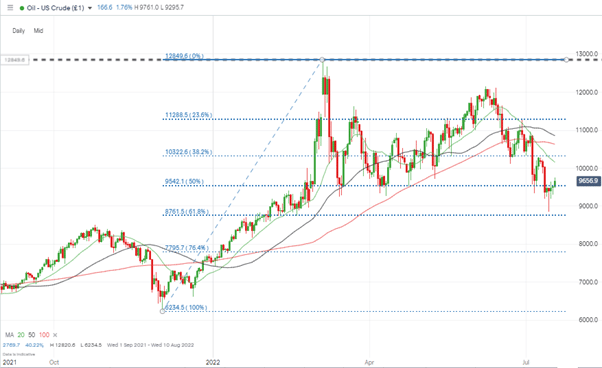
The threat of a global recession has resulted in oil’s bull run hitting the skids. Price continues to slide and remains below the 20, 50 and 100 SMAs on the Daily Price Chart. In the shorter term, the focus will be on $95.42 and $87.61, which mark the 50% and 61.8% Fib retracement levels, respectively.
US Crude Oil – Daily Candles – Fib Retracement
Source: IG
Long positions
- Entry Level 1: 95.42 – 50% Fib Retracement level dating back to December 2021.
- Entry Level 2: 87.61 – 61.8% Fib Retracement level dating back to December 2021.
- Price Target 1: 101.52 – Region of the 20 SMA on the Daily Price Chart.
- Stop Loss: < 87.61
Crypto – Bitcoin & Ethereum
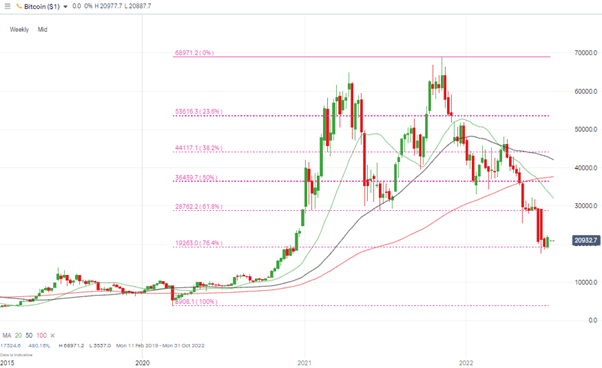
Bitcoin and Ethereum continue to bounce from the year-to-date lows posted at the start of July. Over the last week, BTC and ETH posted respective gains of 2.13% and 1.21%. While minor in cash terms, these price gains offer crypto fans some relief. Any period of price consolidation can result in many wondering if the crypto sell-off is finally over.
Bitcoin Price Chart – Weekly Candles
Source: IG
Bitcoin Long positions
- Entry Level 1: 20,333 – Region of 20 SMA on Daily Price Chart.
- Entry Level 2: 19,263 – Region of the 76.4% Fibonacci retracement level dating back to March 2020
- Price Target 1: 23,589 – Region of 50 SMA on Daily Price Chart.
- Stop Losses: < 19,263 – Region of the 76.4% Fibonacci retracement level dating back to March 2020. This is the last recognised Fib retracement level before a 100% fallback in price, and all of the covid-lockdown gains are given up.
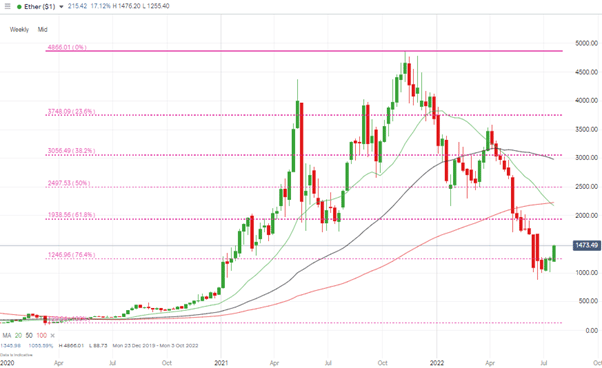
Ethereum
Trade flow reports from Asia on Monday morning point to walls of buying and selling pressure being formed in ETH. Buyers look solid down to 1,260, and sellers lined up in the region of 1,437. A break of either of these levels would signify a new trend is forming.
Ethereum Chart – Weekly Candles – Fib Support Levels
Source: IG
Ethereum Long positions
- Entry Level 1: 1,246 – Region of the 76.4% Fibonacci retracement level dating back to March 2020.
- Entry Level 2: 1,342 – Region of 50 SMA on Daily Price Chart.
- Price Target 1: 1,952 – Region of 100 SMA on Daily Price Chart.
- Stop Losses: < 1,177 – Region of 20 SMA on Daily Price Chart.
Risk Statement: Trading financial products carries a high risk to your capital, especially trading leverage products such as CFDs. They may not be suitable for everyone. Please make sure that you fully understand the risks. You should consider whether you can afford to take the risk of losing your money.

Forextraders' Broker of the Month
BlackBull Markets is a reliable and well-respected trading platform that provides its customers with high-quality access to a wide range of asset groups. The broker is headquartered in New Zealand which explains why it has flown under the radar for a few years but it is a great broker that is now building a global following. The BlackBull Markets site is intuitive and easy to use, making it an ideal choice for beginners.