
Our trading signal analysis is based on a comprehensive summary of market data. We use a range of metrics with weighting given to simple and exponential moving averages and key technical indicators.
We created this Weekly Tips section to share possible trade entry and exit points based on our technical analysis. We also have other methods to validate our trades which we can’t publicly share that help to increase their success. All our trades include entry and at least one target price. Stop losses are applied at the reader’s discretion. Our strategies typically trade with a wide stop loss, and risk is further mitigated by trading in small sizes.
FOCUS ON: Downward Momentum Remains Strong But Some Markets Approaching Key Support Levels
- Negative sentiment continues to dominate forex and stock markets
- Relative strength in EURUSD set to be tested by ECB and energy supply fears
- Short-term bounces in GBPUSD and NASDAQ 100 can’t be discounted as those markets approach key support levels
The US Non-Farm Payroll numbers released on Friday were in-line with analyst expectations, but that has done little to lift the mood of the markets. Total US employment levels and job vacancies remain strong, suggesting consumer spending might hold up better than some have predicted. On the other hand, GDP is contracting, and many market analysts expect the technical recession confirmed in July will soon be followed by rising unemployment.
Bearish undertones running through the markets have resulted in many of the technical indicators for risk-on assets remaining in ‘Strong Sell’ mode. For the second week in a row, GBPUSD, EURUSD, the S&P 500 and NASDAQ 100 are all marked as Strong Sell on an hourly and daily basis, which points to continued weakness in those markets. A short-term bounce, such as the one seen in EURUSD in the first half of last week, can’t be ruled out, but the medium-term path of least resistance continues to appear downward.
Eurodollar traders will have Thursday 8th September marked as a date to watch. That is when the ECB will make its next announcement on interest rate policy, with a 50-basis point rise predicted by most of the market. With that interest rate hike already largely priced in, the euro’s next move appears most likely to be triggered by the risk that energy supplies from Russia will be further restricted.
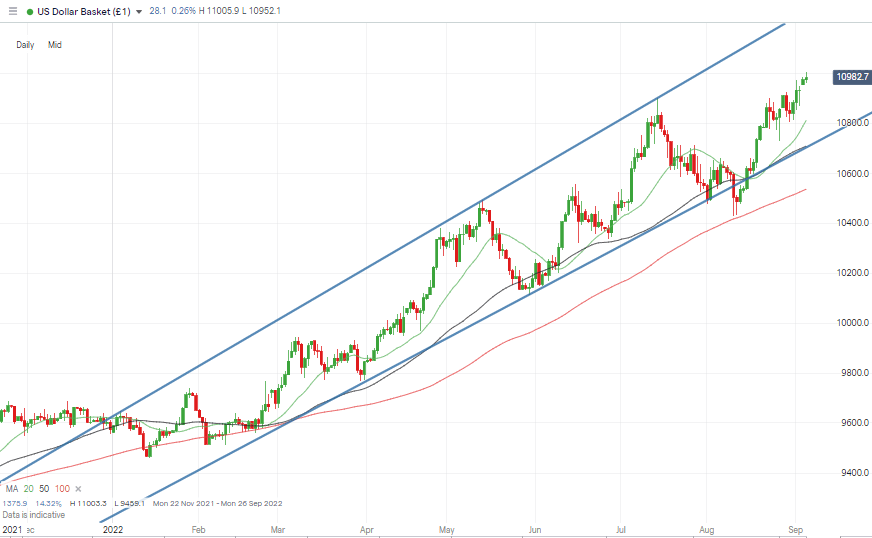
US Dollar Basket Chart – Daily Candles – Bullish Momentum
Source: IG
The meeting of OPEC+ ministers, which starts on Monday 5th September, will further complicate how Western economies are dealing with the security of energy supplies. Going into the meeting, analysts are divided on whether the group will cut or increase supply quota levels of its members.
Even if the agreed supply levels remain unchanged, the bad news for bullish traders is that recent falls in the price of oil haven’t acted as a catalyst for price rises in other asset groups. During the last week, the price of crude softened by more than 5% but was mirrored by more than 2% falls in the S&P 500 and NASDAQ 100 indices.
Instrument | Price | Hourly | Daily |
EUR/USD | 0.9909 | Strong Sell | Strong Sell |
GBP/USD | 1.1467 | Strong Sell | Strong Sell |
USD/JPY | 140.51 | Strong Buy | Strong Buy |
S&P 500 | 3,929 | Strong Sell | Strong Sell |
NASDAQ 100 | 12,087 | Strong Sell | Strong Sell |
FTSE100 | 7,217 | Strong Sell | Strong Sell |
Gold | 1,709 | Strong Sell | Strong Sell |
Crude Oil WTI | 88.61 | Strong Buy | Strong Sell |
Bitcoin | 19,706 | Strong Sell | Strong Sell |
Ethereum | 1,561 | Sell | Strong Sell |
UTC: 09:25
Forex
GBPUSD
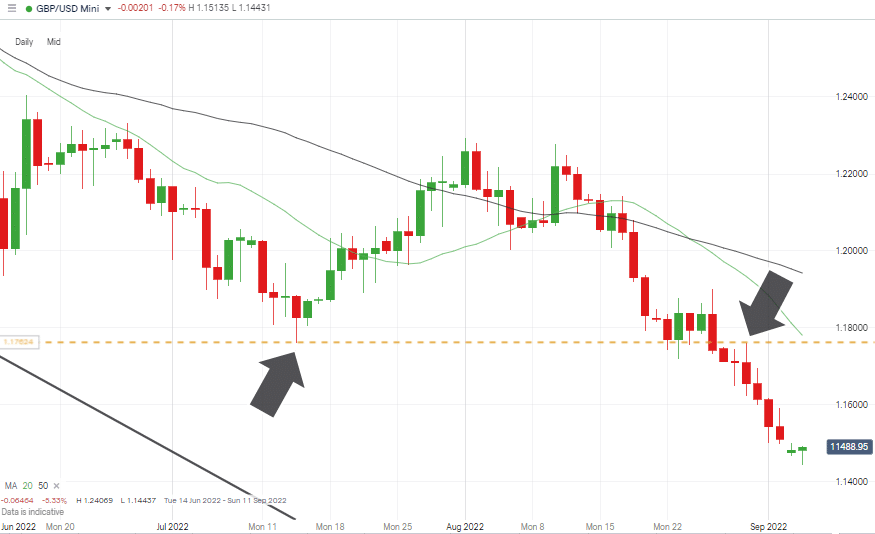
Sterling was one of the big losers of last week. Its 1.72% price fall has taken it to trade below the psychologically important 1.15 price level, which can now be expected to turn from offering support to acting as resistance to any price bounce.
GBPUSD Chart – Daily Candles – Selling into Short-term Strength
Source: IG
The view that the pound had further to fall was highlighted in the Technical Analysis and Trading Ideas Report of 29th August. Traders who entered into trades at 1.1760 will be in positions already through the first price target of 1.1650.
With downward momentum being the dominant theme, the question is how to enter into positions. Last week’s price entry level of 1.1760 was only just clipped during a failed bounce on Tuesday 30th August when price reached its weekly high of 1.17606.
GBPUSD Chart – Hourly Candles – Long-Term Price Support
Source: IG
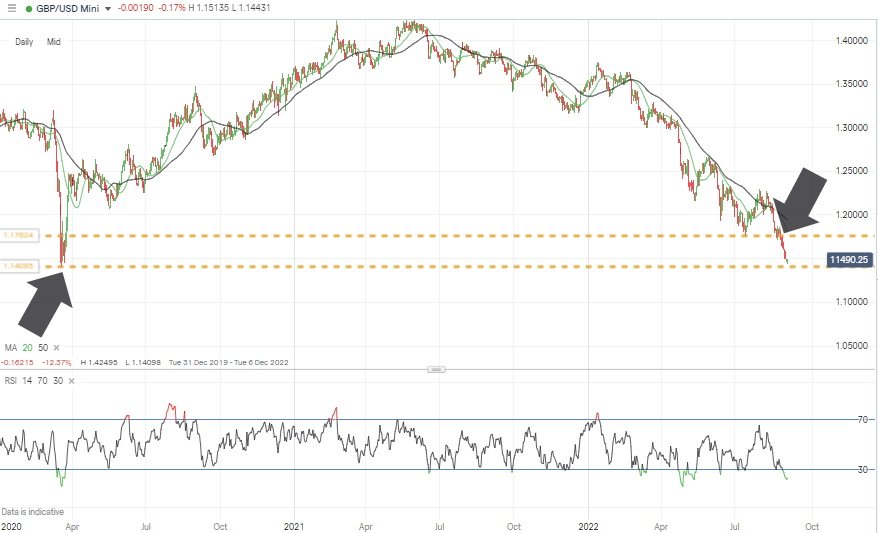
Price charts dating back to 2020 show that the multi-year low of 1.4098 printed on 19th March 2020 could be about to act as resistance. The chance of a bounce in that region is made more likely by the RSI on the Daily Price Chart now being 22, well below the 30 level, commonly seen as a sign that a market is oversold.
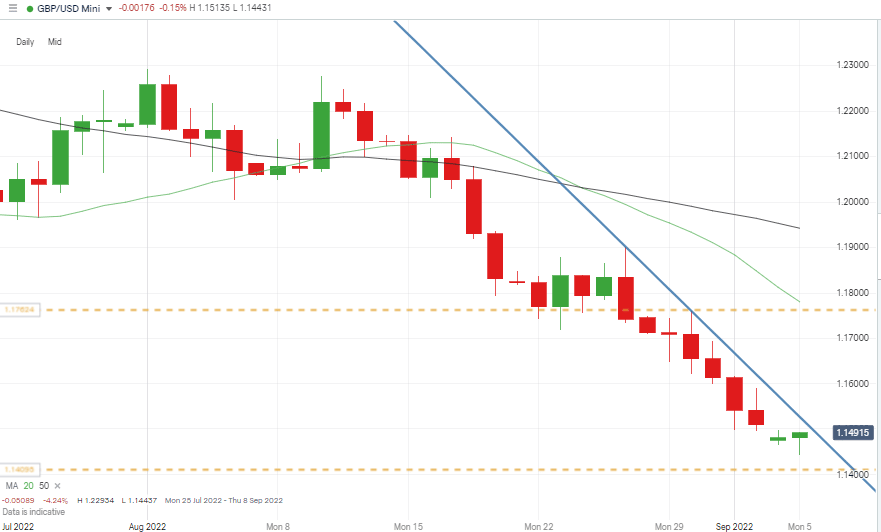
GBPUSD Chart – Hourly Candles – Long-Term Price Support
Source: IG
Short positions
- Entry Level 1: 1.15272 – Region of resistance trendline and above the important 1.500 round number price level.
- Price Target 1: 1.14098 – Price low of March 2020.
- Stop Loss: > 1.15287 – Region of the 100 SMA on the Hourly Price Chart.
Long positions
- Entry Level 1: 1.14098 – Price low of March 2020.
- Price Target 1: 1.15272 – Region of resistance trendline dating from 26th August.
- Price Target 2: 1.1760 – Price low of 14th July 2022. Previously acted as support and now as resistance.
- Stop Loss: < 1.14098.
EURUSD
Eurodollar’s crash through the parity price level has been followed by its trading below 0.99 – price levels not seen since 2003. The ECB’s interest rate announcement due on Thursday could offer some surprises, but the main price driver is concerns about Russia’s energy supplies.
Gazprom’s announcement on Friday that the Nord Stream 1 pipeline would be closed for essential maintenance has done little to allay fears that supplies to pivotal EU economies could be further restricted. The EU has historically relied on Russia for 40% of its gas supplies, and the genuine threat of an energy-supply recession hitting the eurozone can be expected to weigh down the price of the euro.
EURUSD Chart – Daily Candles – Long-term Downtrend
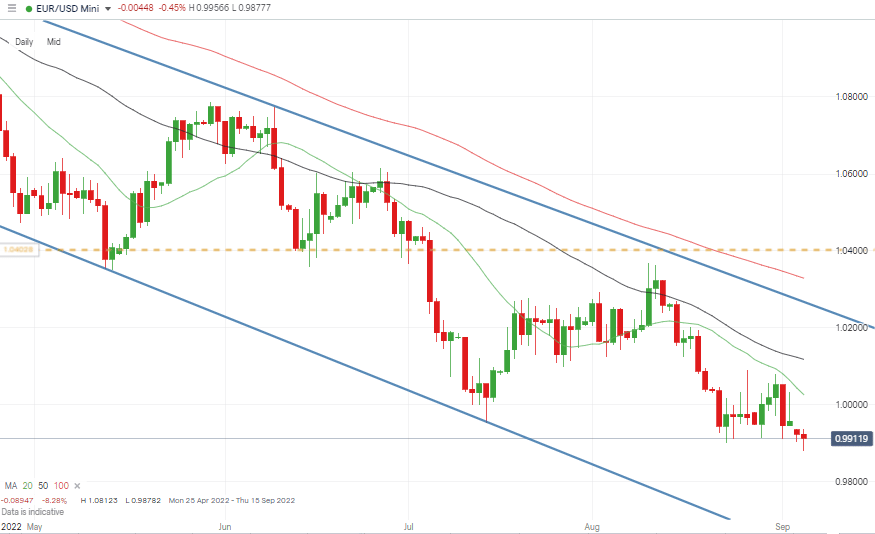
Source: IG
Despite the concerns over energy supplies, EURUSD surprisingly outperformed GBPUSD last week. The relative price moves for both currency pairs were -0.27% and -1.72%. That’s not necessarily good news for EURUSD, which, unlike GBPUSD, doesn’t have a price support level from 2020 coming into play. The euro is entering uncharted territory with most trading opportunities based on timing entry into positions looking to profit from further downward momentum.
EURUSD Chart – Hourly Candles – Trading Below Parity
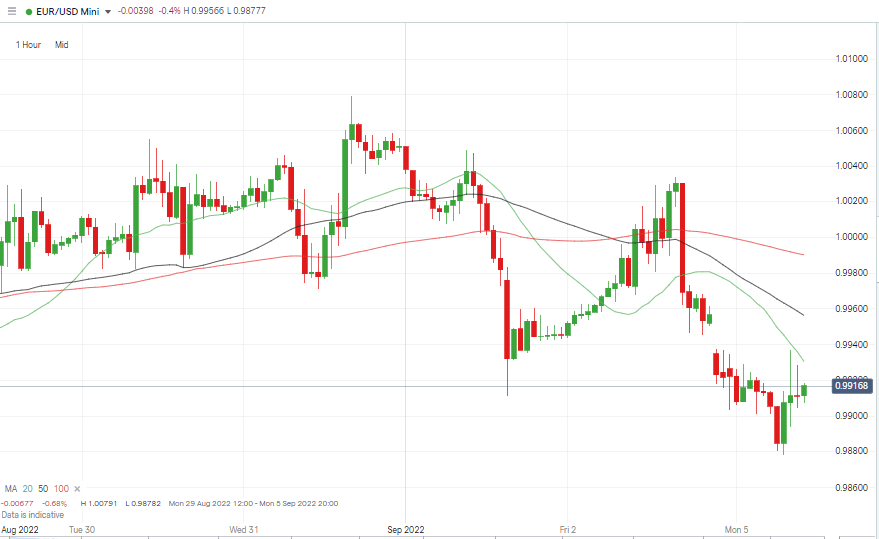
Source: IG
Short positions
- Entry Level 1: 0.99305 – Selling into short-term strength using the region of the 20 SMA on the Daily Price Chart as a guide.
- Price Target 1: 0.98702 – Intraday price low of Monday 5th September. Current year-to-date low.
- Price Target 2: 0.96530 – Supporting trendline of downwards price channel dating back to March 2022.
- Stop Loss: > 1.00259 – Region of the 20 SMA on the Daily Price Chart and just above the key parity price level.
Long positions
- Entry Level 1: 1.0000 – A breakout strategy based on buying pressure coming back into the market if the parity price level is tested.
- Price Target 1: 1.01602 – 50% Fibonacci retracement of the price rally from 14th July to 10th August 2022.
- Stop Loss: < 0.98702 – Intraday price low of Monday 5th September. Current year-to-date low.
Indices
NASDAQ 100
Major US equity indices posted another down week despite the stable US employment situation. Long-held doubts about the health of the US economy appear to be leading major investors to reduce the amount of risk in their portfolios. However, some will be looking to pick the bottom of the market as the index approaches a key Fibonacci retracement support level.
The rally in the NASDAQ between 16th June and 16th August represented a 24.33% increase in value, and the 61.8% Fib retracement price level of that move sits at 12,062 and has acted as support since Thursday 1st September.
NASDAQ 100 Chart – Daily Candles – Price Consolidation at Fib Level
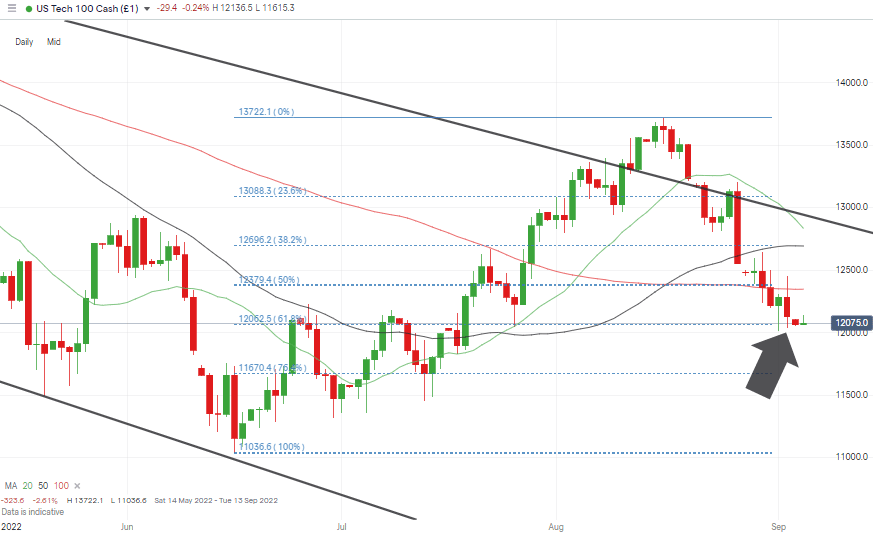
Source: IG
With the price of the NASDAQ consolidating on that Fib level, it looks like the 12,000-price level is the one to watch to determine if the market will bounce again or continue its downward path.
NASDAQ 100 Chart – Hourly Candles – Fib Retracement Support vs SMAs
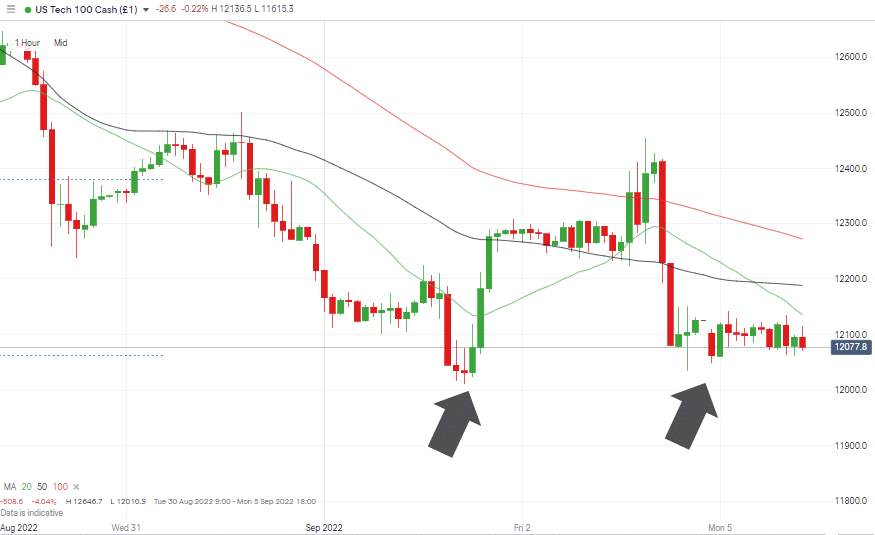
Source: IG
Short positions
- Entry Level 1: 12,379 – 50% Fib retracement of the June – August rally and region of the 100 SMA on the Daily Price Chart (12,346).
- Price Target 2: 12,000 – Key support/resistance price level.
- Price Target 1: 11,036 – Year to date price low of 16th June 2022.
- Stop Loss: >12,693 – Region of the 50 SMA on the Daily Price Chart, which has converged with the 38.2% Fib retracement level (12,696).
Long positions
- Entry Level 1: 12,000 – Round number price support level and region of 62.8% Fib retracement support
- Price Target 1: 12,346 – Region of the 100 SMA on the Daily Price Chart.
- Price Target 2: 13,722 – Price high of 16th August 2022.
- Stop Loss: < 11,036 – Year to date price low of 16th June 2022.
Crypto – Bitcoin & Ethereum
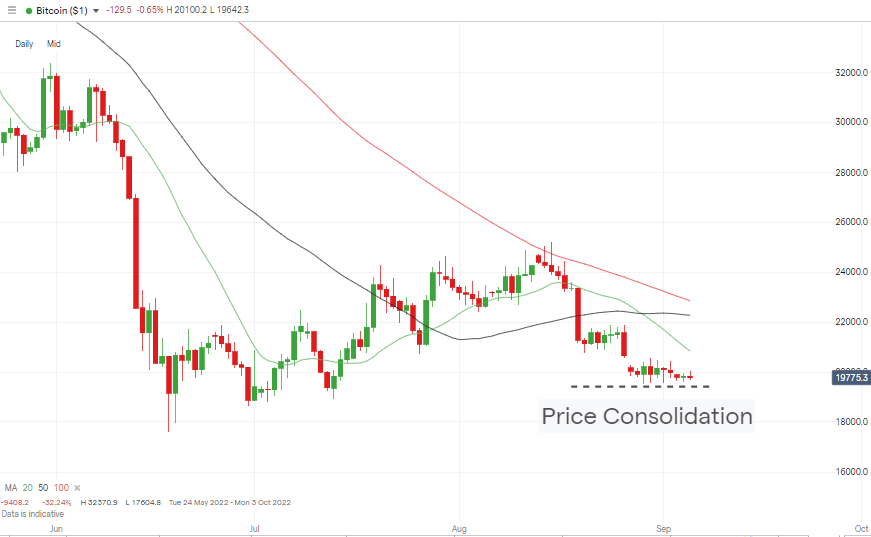
In a week of mixed fortunes for cryptocurrencies, Bitcoin slightly lost ground while Ethereum posted a +7% price gain. Bitcoin’s 0.48% fall in value over the week can be interpreted as a sign of strength compared to the larger price falls in more conventional asset groups such as stocks and forex. The price consolidation by BTC in the region of $20,000 will undoubtedly offer some hope to crypto bulls, but ETH’s relative outperformance remains the main talking point of the crypto markets.
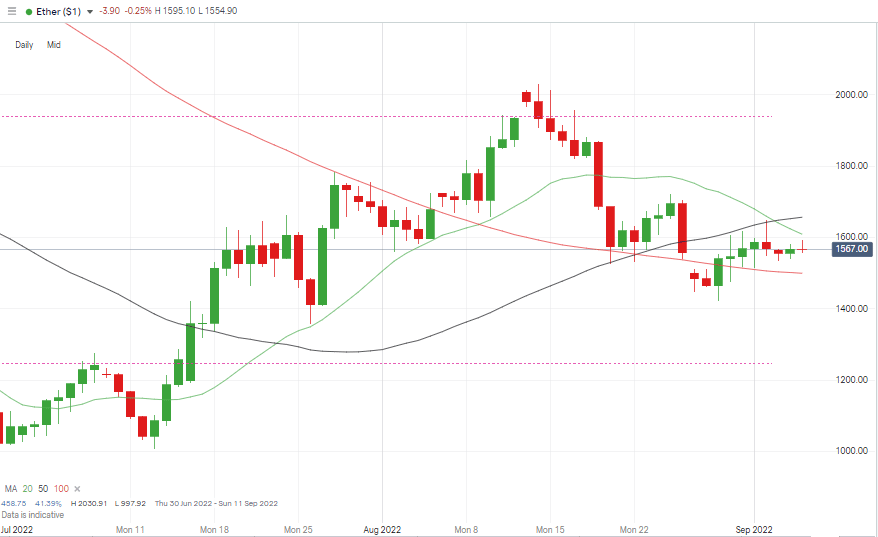
The Merge upgrade being implemented on the Ethereum blockchain continues to offer hope to holders of the coin that it will, by the end of the year, have improved functionality and be able to operate using far less energy. That’s been reflected in the price of ETH rallying to a point where it now sits between key SMAs on the Daily Price Chart.
Bitcoin Price Chart – Daily Candles
Source: IG
Bitcoin Long positions
- Entry Level 1: 20,836 – Region of 20 SMA on Daily Price Chart. Buying into price strength should BTC break through the $20,000 price level.
- Price Target 1: 21,228 – Trend line formed between 18th June and 19th August 2022. Previously acted as support and now represents resistance.
- Price Target 2: 22,853 – Region of 100 SMA on Daily Price Chart.
- Stop Losses: < 19,263 – Region of the 76.4% Fibonacci retracement level of the price rally, which started in March 2020.
Ethereum
Ethereum Chart – Daily Candles
Source: IG
Ethereum Long positions
- Entry Level 1: 1,499 – Region of the 100 SMA on the Daily Price Chart, which sits just below the psychologically important $1,500 price bar.
- Price Target 1: 1,656 – Region of the 50 SMA on the Daily Price Chart, which acted as resistance on Friday 2nd September.
- Price Target 1: 1,938 – 61.8% Fibonacci retracement resistance level of the rally, which started in March 2020, and close to the psychologically important 2,000 price level.
- Stop Losses: < 1,356 – Price low of 26th July 2022 and below the round number price level of $1,400
Risk Statement: Trading financial products carries a high risk to your capital, especially trading leverage products such as CFDs. They may not be suitable for everyone. Please make sure that you fully understand the risks. You should consider whether you can afford to take the risk of losing your money.

Forextraders' Broker of the Month
BlackBull Markets is a reliable and well-respected trading platform that provides its customers with high-quality access to a wide range of asset groups. The broker is headquartered in New Zealand which explains why it has flown under the radar for a few years but it is a great broker that is now building a global following. The BlackBull Markets site is intuitive and easy to use, making it an ideal choice for beginners.