
FOCUS ON: Bounce Leaves Markets Mid-Range With Key Inflation Data Due To Be Released
- A short-term bounce in risk assets marks the end of markets being oversold on a short-term basis
- A heavy news week awaits traders of GBPUSD
- EURUSD surged on the back of ECB rate news but now sits below a key resistance level
A burst of buying activity in risk-on assets has put markets in an interesting position ahead of a busy news week. The bounce in GBPUSD and the NASDAQ 100 index resulted in respective week-on-week gains of 1.80% and 4.51% in those markets, and EURUSD posted a 2.53% return on the back of determined intervention by the ECB.
The potential for short-term rallies in GBPUSD and NASDAQ was identified in the Technical Analysis and Trading Ideas Report of 5th September. Prices in both of those markets benefited from them touching key support levels when they were oversold on a daily timeframe. Eurodollar’s surge back above parity was fuelled less by technical indicators and more by the unprecedented 0.75% interest rate rise announced by the ECB on Thursday.
Continued weakness in oil prices (down 2.92% on the week) could help support stock markets, but the appetite for further moves in all risk assets looks set to be tested by important data releases due this week.
Monday
- UK GDP
Tuesday
- UK Unemployment rate
- Germany ZEW economic sentiment
- US Consumer price index (CPI)
Wednesday
- UK Consumer price index (CPI)
- UK Producer price index (PPI)
- UK Retail price index (RPI)
- Eurozone Industrial production
- US Producer price index (PPI)
Thursday
- Eurozone Trade balance
- US Retail sales
One big news announcement removed from this week’s calendar is the Bank of England’s decision on UK interest rate levels. That has been postponed for a week as a mark of respect for Queen Elizabeth II.
Instrument | Price | Hourly | Daily |
EUR/USD | 1.0160 | Strong Buy | Buy |
GBP/USD | 1.1673 | Strong Buy | Sell |
USD/JPY | 142.85 | Strong Buy | Strong Buy |
S&P 500 | 4,075 | Strong Buy | Neutral |
NASDAQ 100 | 12,632 | Strong Buy | Neutral |
FTSE100 | 7,388 | Strong Buy | Buy |
Gold | 1,723 | Strong Buy | Strong Sell |
Crude Oil WTI | 86.02 | Strong Buy | Strong Sell |
Bitcoin | 21,880 | Sell | Strong Buy |
Ethereum | 1,738 | Sell | Strong Buy |
UTC: 09:06
US Dollar Basket Chart – Daily Candles – Supporting Trendline
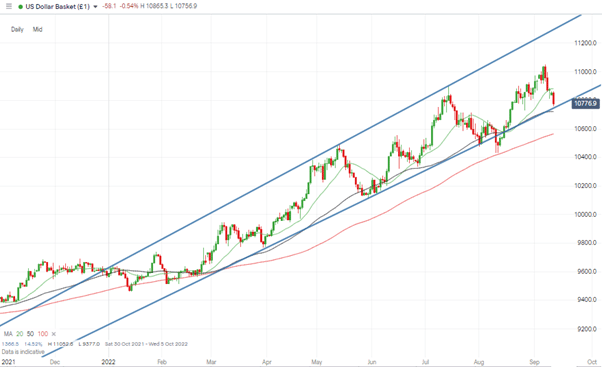
Source: IG
The US Dollar basket’s upward price channel remains intact despite the recent move into other currencies. With price resting on multi-month trendline support, there is potential for the upward trend to continue, but a break of that line would signal a more significant shift in sentiment.
Forex
GBPUSD
While the potential for a bounce in the region of the multi-year low of 1.14098 was relatively easy to predict, there is less certainty about how far it will run. That support level marked the price low of March 2020, and while price has rebounded to 1.1673 cable, traders face a busy week of UK news announcements, even with the postponed BoE interest rate decision.
Another test of 1.14098 remains a distinct possibility. The medium-term prognosis for the UK economy remains bearish, and some in the markets are questioning the wisdom of the Bank’s decision to delay acting when UK inflation is already double-digits.
GBPUSD Chart – Daily Candles – Rebound off multi-year low
Source: IG
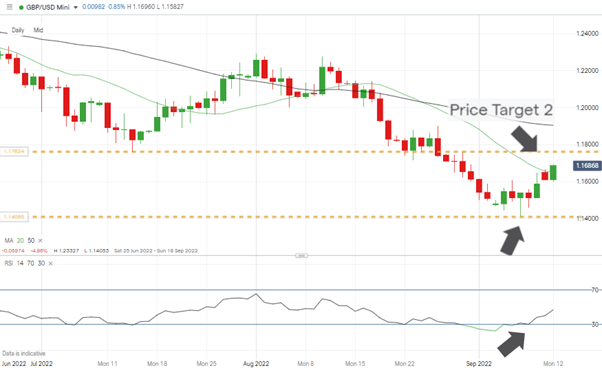
The long GBPUSD strategy identified on 5th September burst through its first price target of 1.15272 and also cut through the resistance offered by the trendline dating from 26th August. The second price target of 1.1760 is now in view, and the way that the price low of 14th July has previously acted as support suggests it could restrict or slow down further moves to the upside.
GBPUSD Chart – Monthly Candles – Long-Term Price Support
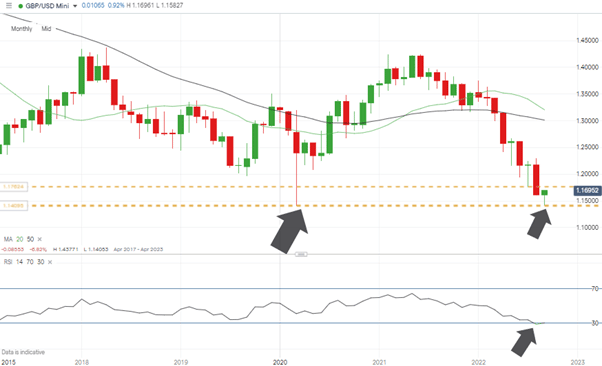
Source: IG
Tuesday’s US inflation report is followed by a batch of UK inflation data on Wednesday. Those announcements could potentially send the price of GBPUSD in either direction and with price trading mid-range, both long and short strategies should be considered.
Short positions
- Entry Level 1: 1.1760 – Price low of 14th July 2022. Acted as support in August and is now likely to offer resistance.
- Price Target 1: 1.16514 – Region of 20 SMA on Daily Price Chart.
- Price Target 2: 1.14098 – Price low of March 2020.
- Stop Loss: > 1.19051 – Region of the 50 SMA on the Daily Price Chart.
Long positions
- Entry Level 1: 1.16514 – Region of 20 SMA on Daily Price Chart. Buying into a short-term pullback.
- Price Target 2: 1.1760 – Price low of 14th July 2022.
- Stop Loss: < 1.14098.
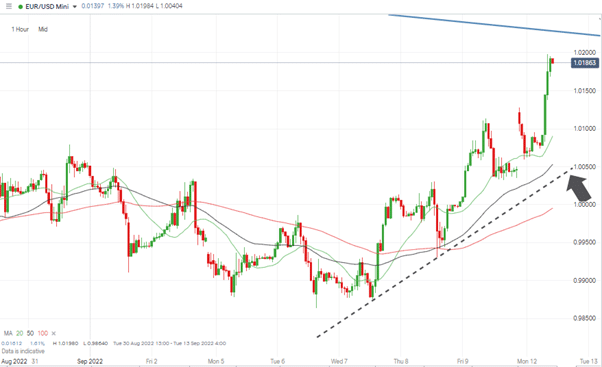
EURUSD
The record-breaking 0.75% interest rate rise posted by the ECB on Thursday was backed up by guidance that can only be described as hawkish. Peter Kažimír, Slovakia’s central bank chief, who sits on the ECB’s governing committee, explained that “Inflation remains unacceptably high” and continued by saying: “The priority now is to continue vigorously the normalisation of monetary policy.” The comments outline that despite the risk of an energy crisis, the Bank’s leaders are prioritising controlling inflation rather than managing rates in a way that might encourage economic growth.
An update on German economic sentiment is due on Tuesday, and eurozone industrial production numbers follow on Wednesday. Both reports will offer an insight into the health of the eurozone and are usually eagerly awaited by traders. The main price driver appears to be the reverberations from last Thursday’s ECB announcement.
EURUSD Chart – Daily Candles – Long-term Downtrend
Source: IG
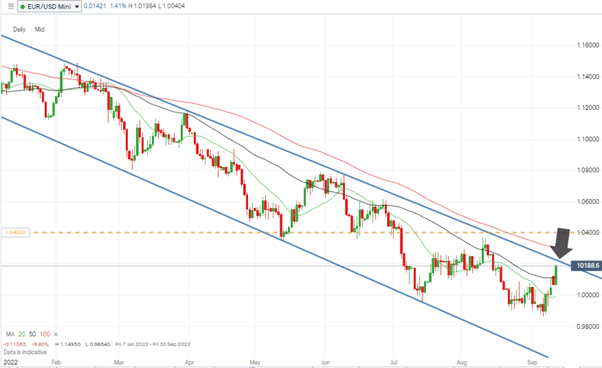
Price is approaching a long-term resistance point, the upper end of the downward price channel that dates back to the start of 2022. With the RSI on the Daily Price Chart at the same time now being above 60, there is a chance the recent surge will experience some form of pullback, even if only to the supporting trendline identified in the Hourly Price Chart.
EURUSD Chart – Hourly Candles – Trading Below Parity
Source: IG
Short positions
- Entry Level 1: 1.0210 – Selling into strength and using the upper trendline of the long-term downward price channel as a guide.
- Price Target 1: 1.01602 – 50% Fibonacci retracement of the price rally from 14th July to 10th August 2022.
- Price Target 2: 1.005 – Region of the supporting trendline on the Hourly Price Chart.
- Price Target 3: 1.000 – Price parity with the US dollar. Psychologically important level.
- Stop Loss: > 1.03046 – Region of the 100 SMA on the Daily Price Chart and just above the big number price level of 1.03
Long positions
- Entry Level 1: 1.005 – Region of the short-term trendline on the Hourly Price Chart, which dates back to Wednesday 7th September.
- Price Target 1: 1.01602 – 50% Fibonacci retracement of the price rally from 14th July to 10th August 2022.
- Entry Level 2: 1.0210 – Resistance provided by the upper trendline of the downwards price channel.
- Stop Loss: < 0.98702 – Intraday price low of Monday 5th September. Current year-to-date low.
Indices
NASDAQ 100
The rally in the NASDAQ 100 index, which started on Tuesday 6th September, has triggered a strong run into the weekend, with the index posting three consecutive up days for the first time since 29th July. It also established a higher swing-low price pattern on the Daily Price Chart. This offers hope to the bulls that the upward move, which started on 16th June, could be the real deal.
As with EURUSD, the NASDAQ 100 index is approaching the upper end of a multi-month trading channel, and resistance can be expected in the region of 12,790. With the RSI at 50 on the Daily Price Chart, the market is neither oversold nor overbought on that timeframe. That leaves the door open to the US inflation report due on Tuesday, triggering a move in either direction.
NASDAQ 100 Chart – Daily Candles – Downwards Price Channel
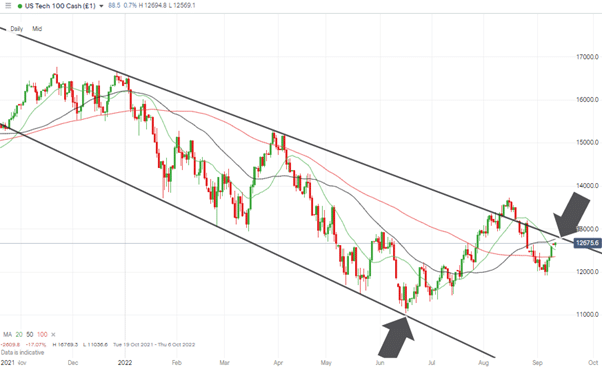
Source: IG
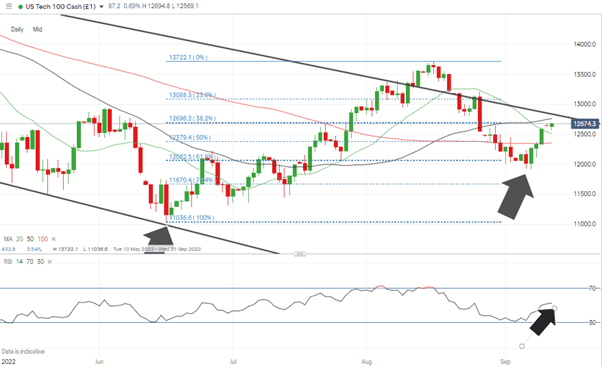
Consideration also needs to be given to the 38.2 % Fib retracement price level of the rally, which occurred between June and August. Price has started the week trading in the region of that Fib level which sits at 12,696. That could well signal a period of sideways trading until Tuesday’s inflation number is released.
NASDAQ 100 Chart – Daily Candles – Price Consolidation at Fib Level
Source: IG
Short positions
- Entry Level 1: 12,762 – Region of the 50 SMA on Daily Price Chart. Currently sits just below the upper trendline of the downward price channel.
- Price Target 1: 12,358 – Region of the 100 SMA on the Daily Price Chart.
- Price Target 2: 11,917 – Price low of Wednesday 7th September 2022.
- Stop Loss: >13,000 – Above the downward trendline and psychologically important round number price level.
Long positions
- Entry Level 1: 12,666 – The resistance in the region of 12,762 – 12,790 doesn’t leave much upside on long positions placed at current price levels, though a short-term scalping strategy could be used to trade the gap fill between 12,666 and 12,762.
- Entry Level 1: 12,790 – The alternative approach is to wait for that resistance to be tested and breached before entering a longer-term trade which follows a breakout strategy approach.
- Price Target 1: 13,722 – Price high of 16th August 2022.
- Price Target 2: 13,817 – Region of the 100 SMA on the Weekly Price Chart.
- Stop Loss: < 11,917 – Price low of Wednesday 7th September 2022.
Crypto – Bitcoin & Ethereum
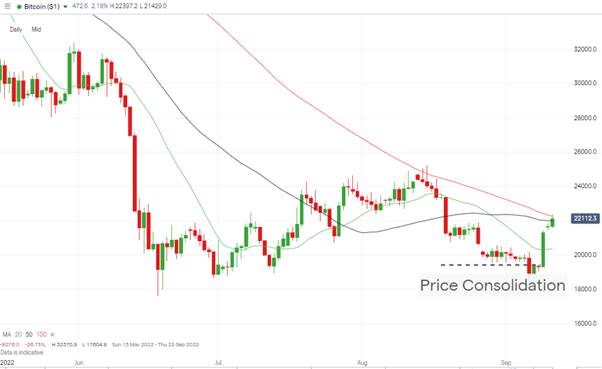
After a period of price consolidation, bitcoin and ethereum posted double-digit price rises last week. The respective price moves of 11.03% and 11.34% being enough to suggest a groundswell of optimism has come into the sector rather than it being a case of investors picking out preferred coins.
Bitcoin’s surge through the psychologically important $20.000 price level has taken it to touching distance of the 50 and 100 SMAs on the Daily Price Chart. Ethereum’s bounce, in contrast, followed several weeks of outperformance. That leaves ETH forming a more bullish price pattern thanks to it currently trading above all the key SMA metrics on the daily timeframe.
Bitcoin Price Chart – Daily Candles
Source: IG
Bitcoin Long positions
- Entry Level 1: 21,988 – Region of 100 SMA on Daily Price Chart. Just below the round number price level of $22,000.
- Price Target 1: 25,204 – Price high of 15th August 2022.
- Stop Losses: < 19,263 – Region of the 76.4% Fibonacci retracement level of the price rally that started in March 2020 and below the key $20k price support level.
Ethereum
Ethereum Chart – Daily Candles – Above Key SMAs
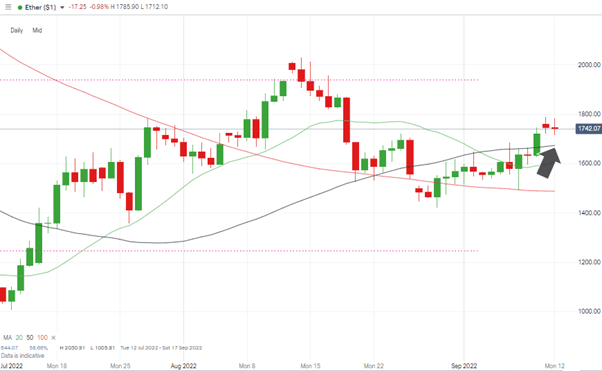
Source: IG
Ethereum Long positions
- Entry Level 1: 1,673 – Buying into weakness in the region of the 100 SMA on the Daily Price Chart.
- Price Target 1: 1,938 – 61.8% Fibonacci retracement resistance level of the rally that started in March 2020. Also, just below the psychologically important 2,000 price level.
- Stop Losses: < 1,422 – Price low of 29th August 2022.
Risk Statement: Trading financial products carries a high risk to your capital, especially trading leverage products such as CFDs. They may not be suitable for everyone. Please make sure that you fully understand the risks. You should consider whether you can afford to take the risk of losing your money.

Forextraders' Broker of the Month
BlackBull Markets is a reliable and well-respected trading platform that provides its customers with high-quality access to a wide range of asset groups. The broker is headquartered in New Zealand which explains why it has flown under the radar for a few years but it is a great broker that is now building a global following. The BlackBull Markets site is intuitive and easy to use, making it an ideal choice for beginners.