

FOCUS ON: Dollar Dominance Confirmed – But What Next As The News Flow Dries Up?
- The British pound and euro plummet into uncharted waters
- Stock markets reel from US Fed’s continued hawkish guidance and prioritisation of tackling inflation rather than attending to slowing growth
- The coming week is quieter in terms of news reports, but Friday’s US CPE report is one to watch
There currently appears to be no end to the US dollar’s surge in value. Sterling has reached lows not seen since 1985, Japan’s government intervened to support the yen for the first time in 24 years, and the euro has plummeted to trade well below parity with the dollar.
The potential for a significant price move last week was identified in the Technical Analysis and Trading Ideas Report of 19th September. A big move was always possible with three central banks, including the US Federal Reserve, all giving updates on interest rate policy in the space of 24 hours.
One event that caught markets by surprise was the UK government’s policy update, initially billed as a “mini-budget”, delivered on Friday. The radical tax reforms in the package exceeded expectations to the extent that sterling posted a 3.6% daily loss in value. That fall represented the largest single-day loss for cable since the height of the Covid pandemic in March 2020 and the Brexit vote of 2016.
The coming week is lighter in terms of scheduled economic announcements. One data point to look out for is the United States Core Personal Consumption Expenditure Price Index report released on Friday 30th September. The core index excludes energy and food items, giving a more specific insight into consumer price inflation on things such as durable goods. The Fed has shared that this number is one it is currently paying particular to, so traders would do well to do the same.
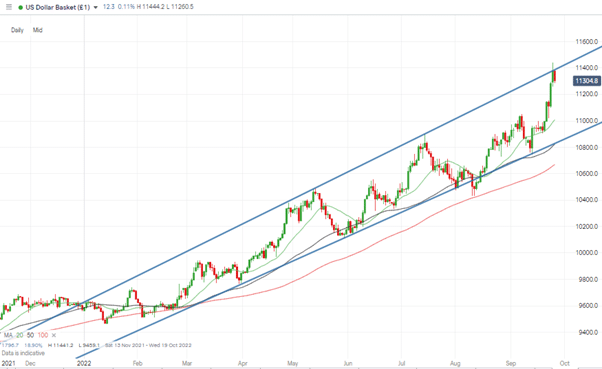
US Dollar Basket Chart – Daily Candles – Touching Trendline Resistance
Source: IG
The US Dollar basket’s rally has taken it to the top end of its multi-month upward price channel. With a large number of major interest rate announcements for the month out of the way, this raises the question of what might act as a catalyst for a breakout to the upside. The Russia-Ukraine conflict is one, and the CPE data is a crucial milestone in the news calendar. Still, considering the recent bull run, there is potential for a period of price consolidation or even a short-term reversal.
Instrument | Price | Hourly | Daily |
EUR/USD | 0.9698 | Buy | Strong Sell |
GBP/USD | 1.0746 | Neutral | Strong Sell |
USD/JPY | 143.68 | Strong Buy | Strong Buy |
S&P 500 | 3,702 | Strong Sell | Strong Sell |
NASDAQ 100 | 11,351 | Strong Sell | Strong Sell |
FTSE100 | 7,055 | Strong Sell | Strong Sell |
Gold | 1,647 | Buy | Strong Sell |
Crude Oil WTI | 78.21 | Strong Sell | Strong Sell |
Bitcoin | 18,809 | Strong Sell | Strong Sell |
Ethereum | 1,298 | Strong Sell | Strong Sell |
Forex
GBPUSD
At Friday’s close, GBPUSD had lost more than 5% of its value on a week-on-week basis. Weak fundamentals and more aggressive interest rate policies in the US had already dragged the pound down, but the budget statement of Friday left sterling shell-shocked and looking for the closing bell.
New chancellor Kwasi Kwarteng caught members of his political party off guard when he announced a raft of radical and aggressive taxation policies. The decision to increase borrowing to support lower taxes for millions represents a high-stakes bet on economic growth materialising to be able to pay back the debt.
With UK inflation at double-digits and more interest rate hikes likely, the markets expressed their concern about the viability of the approach by shaving more than 3% off the price of sterling in Friday’s trading session.
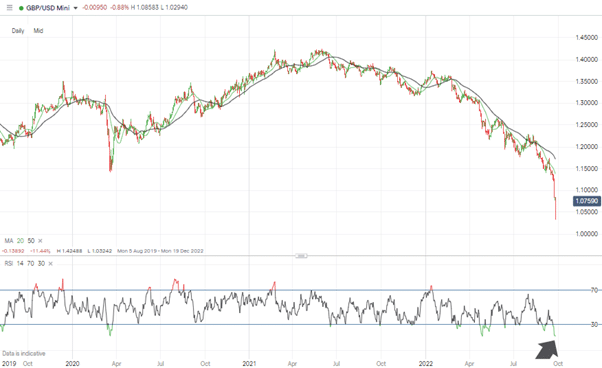
GBPUSD Chart – Daily Candles – New Year to Date Low Source: IG
One metric to factor in is the RSI. On the Monthly Price Chart, this is now at 22.75, and on the Daily Price Chart, it sits at 16.17, which is lower than the 16.71 reading of March 2020, which was followed by a significant bounce.
GBPUSD Chart – Daily Candles – RSI of 16.17
Source: IG
Short positions
- Entry Level 1: 1.0743 – Region of the 20 SMA on the Hourly Price Chart. Selling into any strength using a momentum based strategy.
- Price Target 1: 1.03242 – Year to date price low printed during Asian trading session on Monday 26th September.
- Stop Loss: > 1.10168 – Region of the 50 SMA on the Hourly Price Chart. Price last traded above this metric on Thursday 22nd September 2022.
Long positions
- Entry Level 1: 1.0400 – Round number price level just above the year-to-date low of 1.03242.
- Price Target 1: 1.10168 – Region of the 50 SMA on the Hourly Price Chart.
- Price Target 2: 1.12740 – Price high of Friday 23rd September.
- Stop Loss: < 1.0000 – GBPUSD is trading at price levels not seen since the 1980s, which means there are few technical support levels to draw on. Continued selling pressure could result in the parity price level coming into play.
EURUSD
Last week’s fall in the euro’s value formed part of the long-term downtrend. EURUSD was down 2.78%, which compares relatively well to the 5.39% price slide in GBPUSD.
Geopolitical risk ticked up thanks to a revival of the idea that nuclear weapons might be used in the Ukraine conflict. The Italian general election added to the mix by pointing toward a change of government being about to take place.
The possibility of an energy crisis remains; however, EU leaders have had time to plan contingency measures, including relaxing sanctions on coal imports.
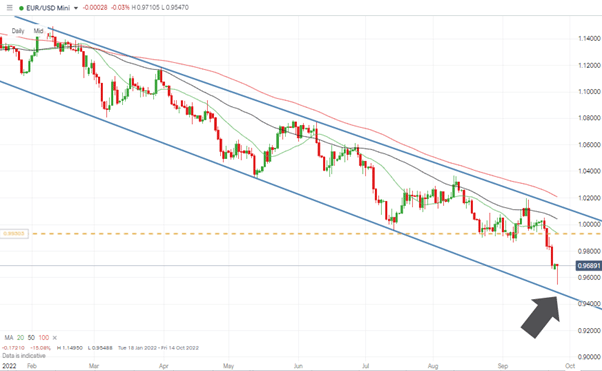
Without a worsening of the fundamental aspects of the eurozone economies, there is a chance for EURUSD to bounce off the supporting trendline, which dates back to March 2022.
EURUSD Chart – Daily Candles – Price Approaching Trendline Support
Source: IG
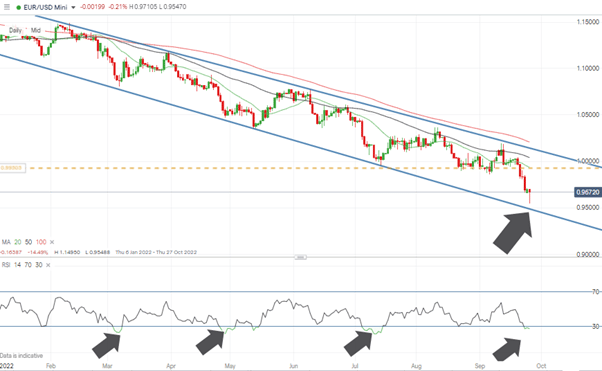
The EURUSD RSI on the Daily Price Chart is trading below 30 for the fourth time this year, and on the previous three occasions this happened, the euro did find short-term strength. The strongest of those three rallies occurred in May and saw EURUSD increase in value by 4.19% in two weeks.
Traders will have to assess whether trading a potential retracement offers sufficient risk-reward or whether waiting for the next rally to pass and selling into the long-term trend is a better option.
EURUSD Chart – Daily Candles – RSI < 30
Source: IG
Short positions
- Entry Level 1: 0.99249 – Selling into strength in the region of the 20 SMA on the Daily Price Chart and support/resistance line, which guided price between mid-July and mid-September.
- Price Target 1: 0.94925 – Region of the multi-month supporting trendline.
- Stop Loss: > 1.0000 – Parity price level.
Long positions
- Entry Level 1: 0.94925 – Region of the supporting trendline
- Price Target 1: 1.0000 – Parity price level.
- Price Target 2: 1.0113 – Region of the upper end of the downward price channel.
- Stop Loss: < 0.9400 – Round number price level.
Indices
NASDAQ 100
On Wednesday, the hawkish guidance provided by the Federal Reserve dampened investor appetite for stocks in general and growth stocks in particular. The Nasdaq 100 accordingly posted another down-week, giving up 3.21% of value.
The Fed raised interest rates by 75 basis points which was in line with analyst projections, leading to an immediate bounce in stocks. But the comments made by Jerome Powell in the supporting reports confirm the Fed is set on prioritising taming inflation rather than supporting economic growth.
With a recession now increasingly likely, the best hope for a turn in the stock markets appears to be any sign that US inflation is cooling. That means the CPE report due on Friday has added importance.
NASDAQ 100 Chart – Daily Candles – Double-Bottom?
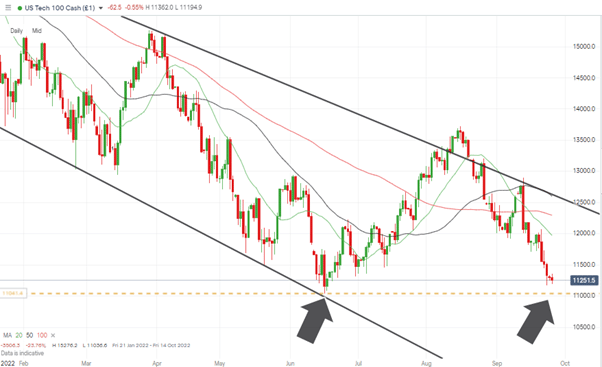
Source: IG
Short positions
- Entry Level 1: 11,971 – Region of the 20 SMA on the Daily Price Chart. Selling into short-term strength to catch the long-term downward trend.
- Price Target 1: 11,036 – Price low of Thursday 16th September 2022.
- Stop Loss: >12,295 – Area of the 50 SMA on the Daily Price Chart.
Long positions
- Entry Level 1: 11,036 – Price low of Thursday 16th September 2022. Trading a double-bottom strategy.
- Price Target 1: 12,000 – Psychologically important price level and region of the 20 SMA on the Daily Price Chart.
- Price Target 2: 12,606 – In extension, the region of the 100 SMA on the Daily Price Chart and upper end of the downward price channel.
- Stop Loss: < 11,000. Round number price support level.
Crypto – Bitcoin & Ethereum
Whilst the mainstream financial markets were reeling, the crypto sector showed relative stability. Ethereum traded flat on the week as investors considered the long-term prospects for that coin following The Merge. Bitcoin showed relative strength and posted a +2% week-on-week gain.
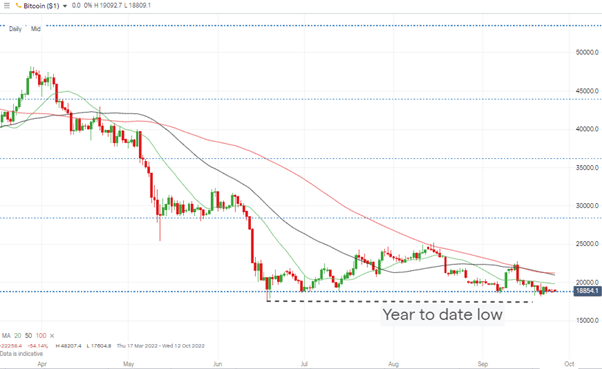
The price level of $17,604, which represents bitcoin’s year-to-date low, remains a critical price support. While that holds, there is hope for a bounce and another test of the $20,000 price level. A break would open the door to further downward movement.
Bitcoin Price Chart – Closing in on Year-to-Date Lows
Source: IG
Bitcoin Long positions
- Entry Level 1: 17,604 – Year to date price low of 18th June
- Price Target 1: 19,853 – Region of 20 SMA on Daily Price Chart. Just below the psychologically important price level of $20,000, which can be expected to offer significant resistance.
- Stop Losses: < 17,604 – The absence of any technical indicators below the $17,604 price level suggests any break of that support would point to the path of least resistance being down. Tight stop losses would therefore be advisable.
Ethereum
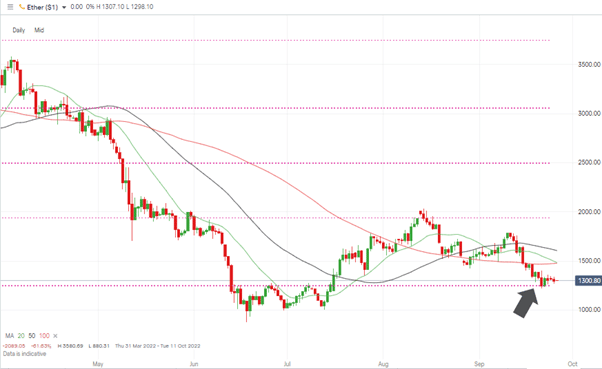
Ethereum Chart – Daily Candles – Bounce Off Fib Support
Source: IG
Ethereum Long positions
- Entry Level 1: 1,246 – 76.4% Fibonacci retracement resistance level of the rally, which started in March 2020. Tested on Wednesday 21st and Thursday 22nd September, the price bounced off the support level in both instances.
- Price Target 1: 1,477 – Region of the 100 SMA on the Daily Price Chart.
- Stop Losses: < 880 – Price low of 17th June 2022.
Risk Statement: Trading financial products carries a high risk to your capital, especially trading leverage products such as CFDs. They may not be suitable for everyone. Please make sure that you fully understand the risks. You should consider whether you can afford to take the risk of losing your money.

Forextraders' Broker of the Month
BlackBull Markets is a reliable and well-respected trading platform that provides its customers with high-quality access to a wide range of asset groups. The broker is headquartered in New Zealand which explains why it has flown under the radar for a few years but it is a great broker that is now building a global following. The BlackBull Markets site is intuitive and easy to use, making it an ideal choice for beginners.