

FOCUS ON: A Busy News Week Could Set The Tone For Q4 Trading
- The final quarter of the trading year kicks off with a batch of key data releases
- Dollar strength and risk aversion are still the dominant themes, but will there be a turn in sentiment before the end of the year
- GBP/USD rollercoaster ride might be over for now, but there are still plenty of trading opportunities on the horizon
The global economy this week moves into the fourth and final financial quarter of a dramatic year. A move towards risk-off assets dominated the first nine months of 2022. The question now is whether that trend will continue.
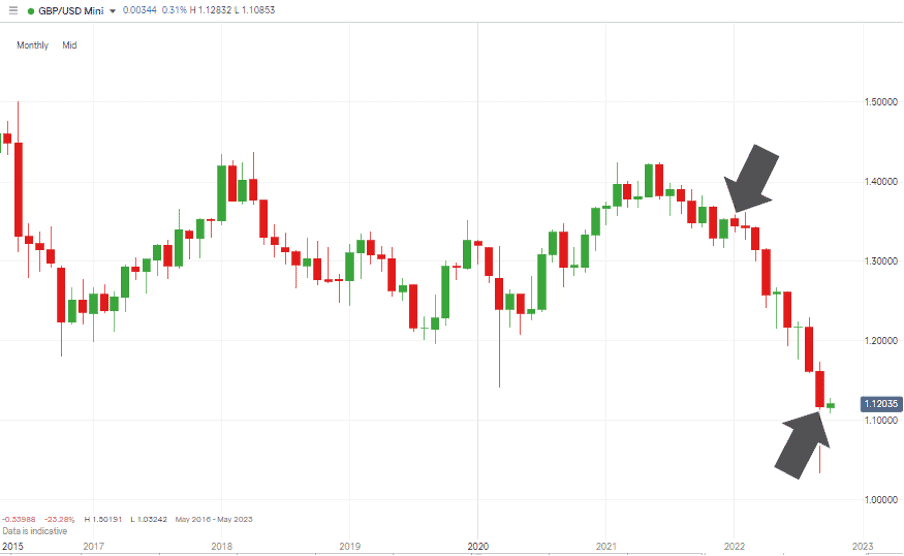
One of the biggest beneficiaries of the move to safety has been the US dollar – and other major currencies have tended to suffer as a result. Uncertainty about the prospects for the global economy would have been enough to see a shift to the greenback; however, the US Federal Reserve’s willingness to hike interest rates faster than most of its peer group has left investors doubling up on USD positions. A move reflected by EUR/USD and GBP/USD, respectively losing 13.78% and 17.48% of their value in the first three quarters of the year.
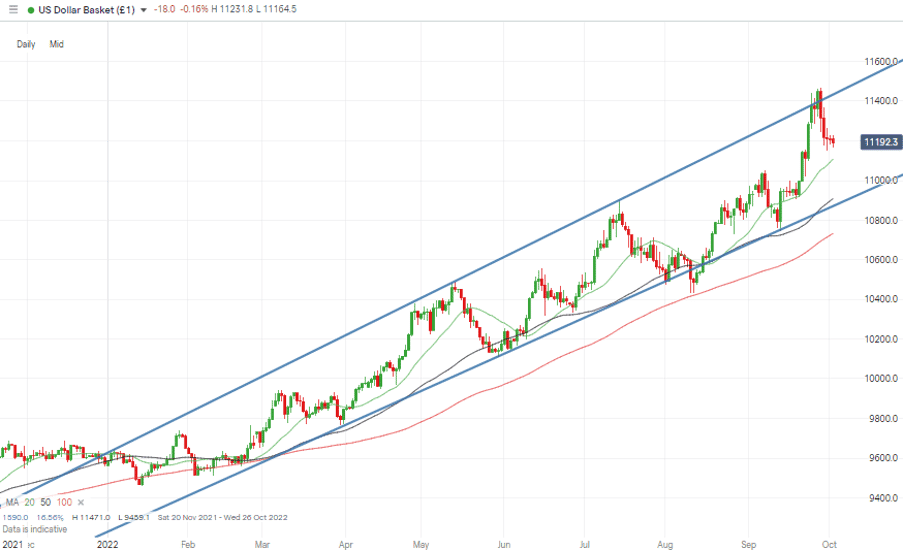
The US Dollar Basket Index continues to trade within its multi-month upwards price channel. Until that breaks, there appears little reason to consider currencies which have adopted less hawkish interest rate policies will make much ground against the dollar. Recent guidance provided by the Bank of England and the European Central Bank that 75 basis point hikes could be on the way will influence price, but it could be argued they are in many ways too little, too late.
Signs which could signal an end to the era of global monetary tightening might be found in a different corner of the world. Australia and New Zealand’s central banks update their interest rate policies this week. Both adopted an early and aggressive approach to raising rates and there is speculation that they have completed their task of combating inflation. Data which points to that could be seen as a sign that stable or lower interest rates in those countries could be around the corner.
The announcement by the RBA on Tuesday 4th October, and RBNZ on Wednesday 5th October, will be closely monitored by international and local traders. Progress there could be seen as a template other currency markets might follow.
US Dollar Basket Chart – Daily Candles – Mid-Channel
Source: IG
The busy news week also includes an OPEC+ meeting on Thursday to consider oil production levels and is topped off by the US jobs numbers being released on Friday 7th October. The Non-Farm Payrolls employment data is regarded as one of the major milestones of the reporting calendar. With so many other key reports to be disclosed, the NFP release adds extra weight to the claim that the coming week could offer clues as to whether the move to the dollar is a trend set to continue or not.
Instrument | Price | Hourly | Daily |
EUR/USD | 0.9815 | Strong Buy | Sell |
GBP/USD | 1.1209 | Strong Buy | Neutral |
USD/JPY | 144.97 | Strong Buy | Strong Buy |
S&P 500 | 3,589 | Strong Sell | Strong Sell |
NASDAQ 100 | 10,944 | Strong Sell | Strong Sell |
FTSE100 | 6,839 | Strong Sell | Strong Sell |
Gold | 1,663 | Neutral | Sell |
Crude Oil WTI | 82.61 | Strong Buy | Neutral |
Bitcoin | 19,159 | Strong Sell | Neutral |
Ethereum | 1,289 | Strong Sell | Strong Sell |
UTC: 08:22
Our trading signal analysis is based on a comprehensive summary of market data. We use a range of metrics with weighting given to simple and exponential moving averages and key technical indicators.
We created this Weekly Tips section to share possible trade entry and exit points based on our technical analysis. We also have other methods to validate our trades which we can’t publicly share that help to increase their success. All our trades include entry and at least one target price. Stop losses are applied at the reader’s discretion. Our strategies typically trade with a wide stop loss, and risk is further mitigated by trading in small sizes.
Forex
GBPUSD
Recent price moves in GBPUSD have been more volatile than those of other major currency pairs due to intervention by the newly formed UK government. New Chancellor Kwasi Kwarteng’s mini budget on Friday 23rd September, caused aftershocks in the price of cable due to the extensive scale of his proposed reforms.
That noise could be turned down slightly thanks to his announcement on Monday 3rd October that one of the more controversial elements is to be removed. The stress test for GBPUSD involved the Bank of England at one point stepping into the market to restore stability, but with the political objectives being scaled back, it looks likely that sterling may have a quieter week.
There is still potential for the BoE to take a more aggressive approach to interest rate rises. The Bank’s next announcement is some weeks off, but the weeklong price crash and rally in GBPUSD has opened the door to them taking a more authoritative tone. Something some in the market would say was already required.
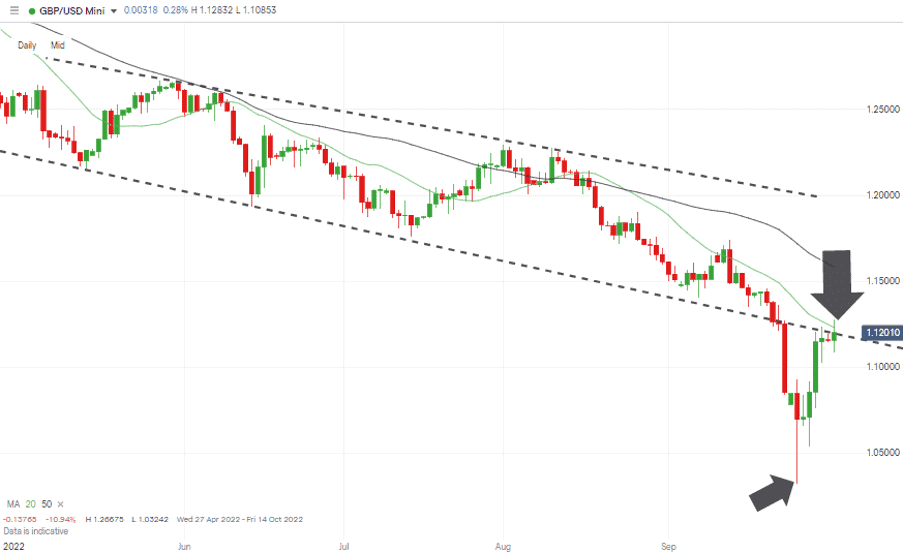
GBPUSD Chart – Daily Candles – Back at Supporting Trendline
Source: IG
Sterling’s prospects hang in the balance. The rally during the second half of last week has brought price back into the region of 1.12 and the region of the lower trendline of the price channel dating back to May 2022. That line which once provided support, can now be expected to offer resistance.
GBPUSD Chart – Monthly Candles – Q1 – Q3 2022 Price Fall
Source: IG
Short positions
- Entry Level 1: 1.1938 – Region of the lower trendline dating from May 2022. Previously offered support and now offers resistance. Potential entry point for strategy based on there being continued downward momentum.
- Price Target 1: 1.03242 – Year to date price low printed on Monday 26th September.
- Stop Loss: > 1.12306 – Region of the 20 SMA on the Daily Price Chart. Price last traded above this metric on Thursday 13th September 2022.
Long positions
- Entry Level 1: 1.12306 – Region of the 20 SMA on the Daily Price Chart. Currently sits just above the supporting trendline. A break of these two resistance levels would point to continued GBP strength and that the path of least resistance is now upward.
- Price Target 1: 1.15839 – Region of the 50 SMA on the Hourly Price Chart.
- Price Target 2: 1.20 – In extension. Psychologically important price level.
- Stop Loss: < 1.03242 – Year to date price low printed on Monday 26th September.
EURUSD
Whilst GBPUSD was enjoying a rollercoaster ride, the EURUSD exchange rate on a week-to-week basis held steady and posted a move of just +0.01%. There was some volatility over the seven-day period but nothing on the scale of the moves seen in the pound.
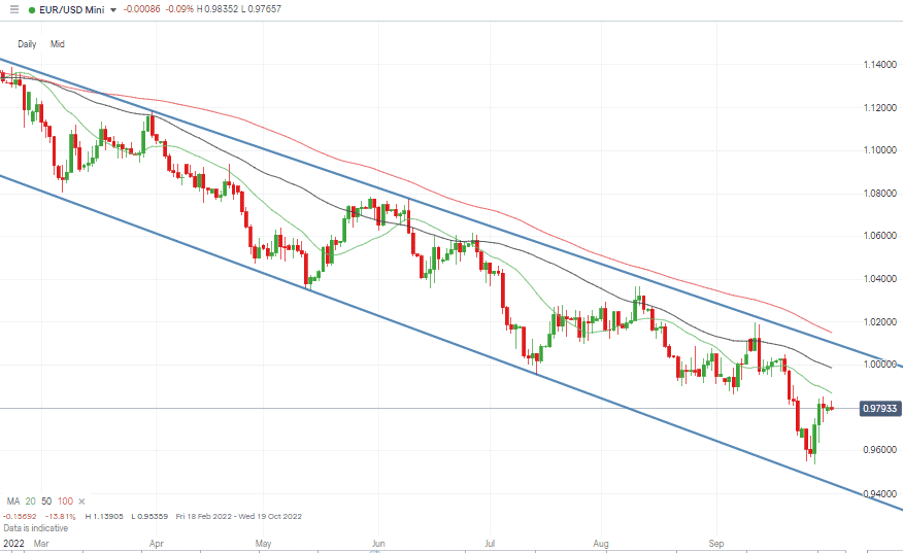
The ECB doesn’t meet to discuss interest rates until 27th October, but guidance is already being offered that rates will rise by 0.75%. That has left price trading mid-range in the currencies’ long-term price channel, leaving opportunities for traders running long and short strategies.
Geopolitical risk and the Ukraine conflict continue to cast a shadow on the Eurodollar exchange rate. Damage sustained by the Nord Stream pipeline has highlighted the precarious nature of energy supplies to the eurozone’s major economies.
EURUSD Chart – Daily Candles – Trading Mid-Range
Source: IG
The EURUSD RSI on the Daily Price Chart is trading at 42, which is also mid-range. With the 20 and 50 SMAs sitting above current price levels, a strong rally would be required to take price higher, and there are few potential catalysts for a surge in buying pressure.
EURUSD Chart – Monthly Candles – Q1 – Q3 2022 Price Fall
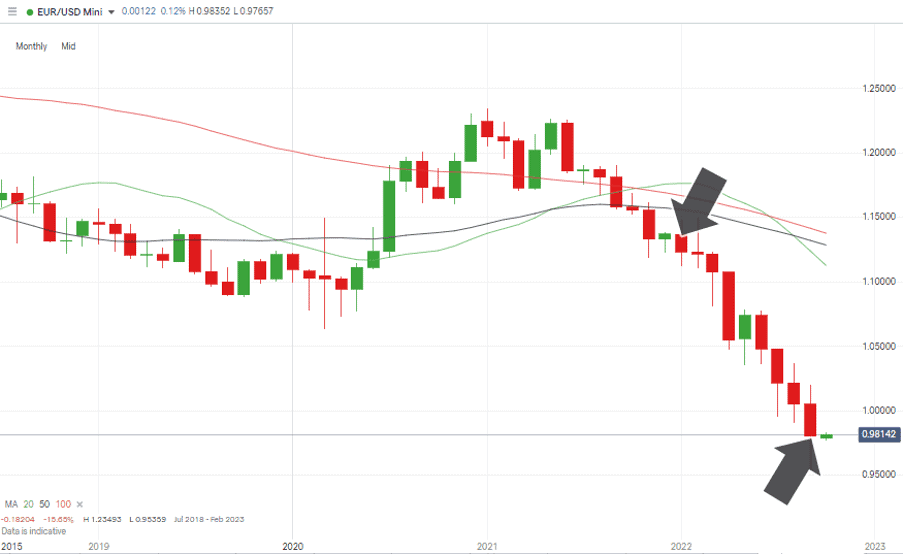
Source: IG
Short positions
- Entry Level 1: 0.98668 – Region of the 20 SMA on the Daily Price Chart.
- Price Target 1: 0.949267 – Region of the multi-month supporting trendline.
- Stop Loss: > 1.0000 – Parity price level and region of the 50 SMA on the Daily Price Chart.
Long positions
- Entry Level 1: 0.98668 – Backing further upward momentum if price breaks through the 20 SMA on the Daily Price Chart.
- Price Target 1: 1.0000 – Parity price level.
- Price Target 2: 1.0101 – Region of the upper end of the downward price channel.
- Stop Loss: < 0.95359 – Price low of 28th September 2022.
Indices
NASDAQ 100
Cash continues to bleed out of the stock markets as investors remove risk from their books in the face of continued uncertainty.
OPEC+ meets this week to discuss quota levels and given crude’s recent price slide production cuts could be on the cards. The Ukraine conflict has once again become a significant cause for concern for investors and inflation in the US is a continuing threat to big corporations.
The Non-Farm Payroll jobs numbers due on Friday will shed light on employment levels, also wage rises. An uptick in salaries would point to inflation moving deeper into the economic system, extending the duration of the hawkish interest rate policy promised by the Fed.
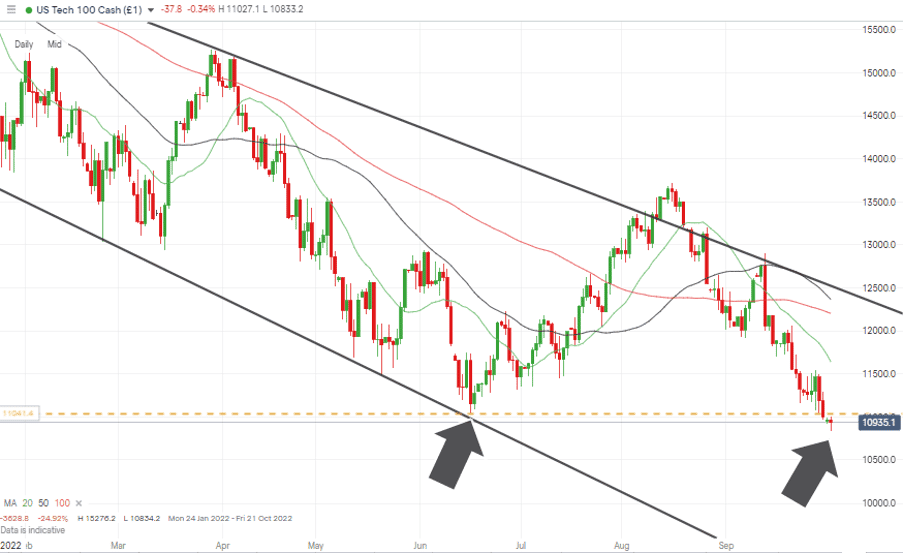
NASDAQ 100 Chart – Daily Candles – Break through key support
Source: IG
The break of the swing low of 11,036, recorded on 16th June, is a significant move and opens the door to further weakness.
Short positions
- Entry Level 1: 11,036 – Selling into any strength which takes price back to kiss the 16th June support level.
- Price Target 1: 10,000 – Psychologically important price level.
- Stop Loss: >11,644 – Area of the 20 SMA on the Daily Price Chart.
Long positions
- Entry Level 1: 11,036 – Price low of Thursday 16th September 2022. Applying a double-bottom strategy.
- Price Target 1: 11,500 – Round number price level and just below the 20 SMA on the Daily Price Chart.
- Price Target 2: 12,221 – In extension, the region of the 100 SMA on the Daily Price Chart.
- Stop Loss: < 11,000. Round number price support level.
Crypto – Bitcoin & Ethereum
Bitcoin posted another up week and gained 1.86% in value. That’s not the sort of gains crypto investors typically seek out, but the price consolidation pattern which started in June continues to hold and will be seen by some as a sign that 2022’s crypto sell-off has run its course.
Ethereum also flatlined with a 0.69% week-on-week price fall. A sign that investors are still considering the long-term prospects for that coin following The Merge.
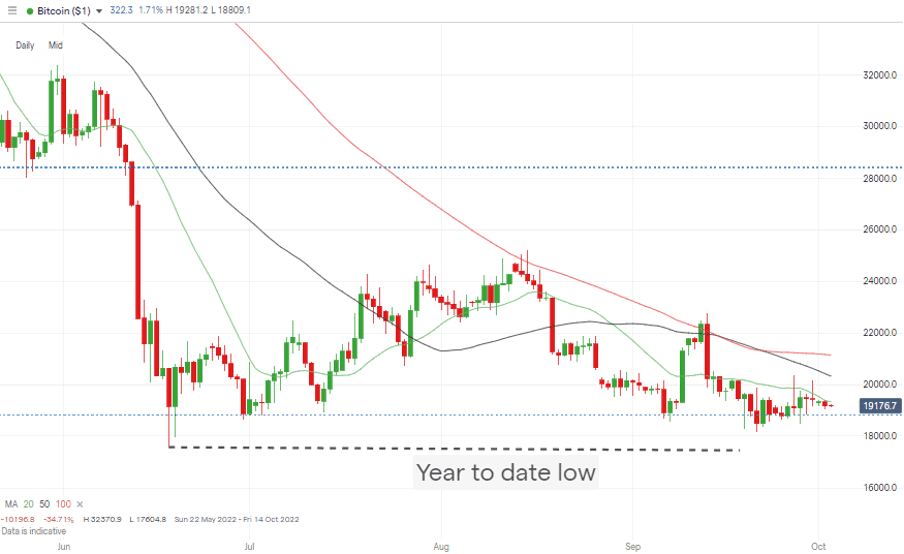
Bitcoin Price Chart – Closing in on Year to Date Lows
Source: IG
Bitcoin Long positions
- Entry Level 1: 19,328 – Region of the 20 SMA on the Daily Price Chart. A break above this metric would open the door to a test of $20,000.
- Price Target 1: 20,000 – 20,319 – Round number price level and region of 50 SMA on Daily Price Chart.
- Stop Losses: < 17,604 – Year-to-date price low printed on 18th June 2022.
Ethereum
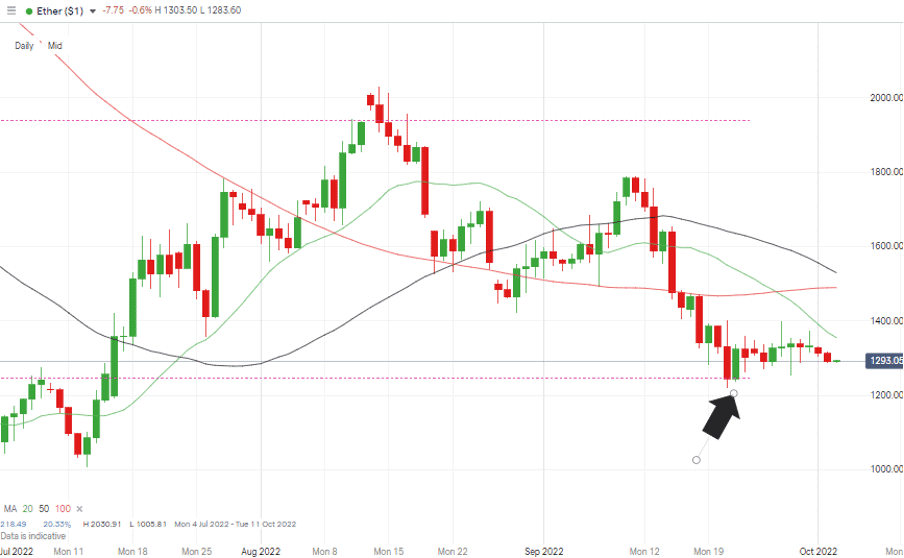
Ethereum Chart – Daily Candles – Bounce Off Fib Support
Source: IG
Ethereum Long positions
- Entry Level 1: 1,246 – 76.4% Fibonacci retracement resistance level of bull run dating back to March 2020. Tested on Wednesday 21st and Thursday 22nd September, and on both dates, price bounced off the support level.
- Price Target 1: 1,355 – Region of the 20 SMA on the Daily Price Chart.
- Price Target 1: 1,489 – Region of convergence of the 50 and 100 SMAs on the Daily Price Chart.
- Stop Losses: < 880 – Price low of 17th June 2022.
Risk Statement: Trading financial products carries a high risk to your capital, especially trading leverage products such as CFDs. They may not be suitable for everyone. Please make sure that you fully understand the risks. You should consider whether you can afford to take the risk of losing your money.

Forextraders' Broker of the Month
BlackBull Markets is a reliable and well-respected trading platform that provides its customers with high-quality access to a wide range of asset groups. The broker is headquartered in New Zealand which explains why it has flown under the radar for a few years but it is a great broker that is now building a global following. The BlackBull Markets site is intuitive and easy to use, making it an ideal choice for beginners.