
FOCUS ON: Consolidation Patterns Mark The Start Of Q4
- Volatility remains a key feature of the markets, but price action in some key markets has adopted consolidation patterns
- Key technical price levels are forming, which will indicate if there is to be a reversal of the downward trend or continued weakness
- US inflation data and the start of earnings season could act as the catalysts that determine the direction of the next move
Friday’s better-than-expected US employment data capped off a busy news week for the markets. The conclusion drawn from the Non-Farm Payroll numbers was that the Fed is likely to take interest rates even higher in an effort to stifle real inflationary pressures.
The Nasdaq 100 index lost 3.43% of value on Friday after the NFP report was released. Stocks were already weakened by the decision OPEC+ took on Thursday 6th October to scale back global production levels of crude oil. But critical technical support held firm and offered hope to those investors thinking this could be the bottom of the stock market sell-off.
In the currency markets, both EURUSD and the US Dollar Basket index continue to trade mid-range. The upcoming US Consumer Price Report, due on Thursday 13th October is lining up to be the big news event of the week, so further consolidation could be likely until that report is released. Sterling’s efforts to rally hard enough to trade back inside its long-term price channel have so far not paid off, and GBPUSD could face further weakness.
Guidance from central banks took a new twist last week when on Tuesday 4th October the Reserve Bank of Australia increased its base lending rate by ‘only’ 0.25%, a rise lower than expected. The RBA had been one of the banks which pioneered aggressive interest rate hikes, and investors were eagerly looking for any suggestion that such a policy has tamed inflation. That was followed by hawkish guidance from the Reserve Bank of New Zealand on Wednesday 5th October.
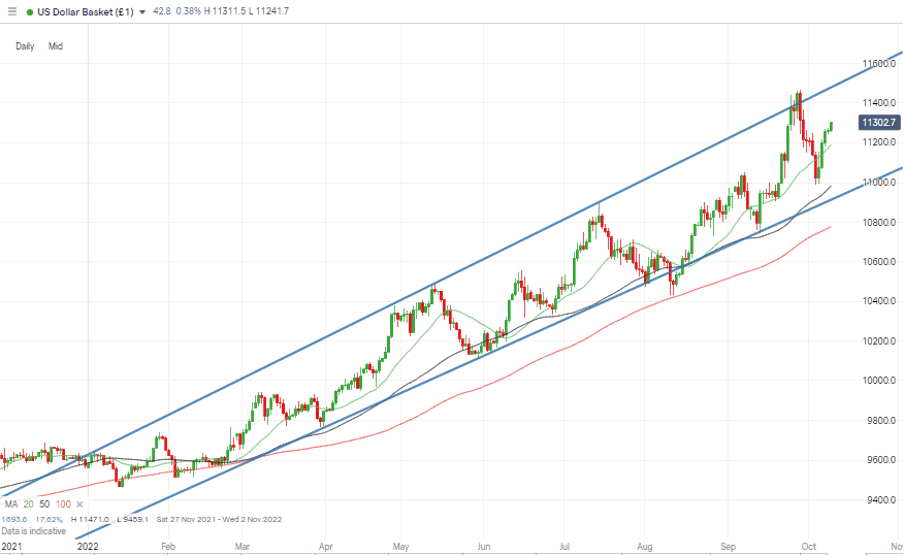
Tuesday’s RBA news resulted in the US Dollar Basket index weakening and breaking below 110 and trading as low as 109.90 on an intra-day basis before rallying to a mid-channel position on the back of the RBNZ announcement. That dip and bounce confirmed the extent to which inflation and interest rates remain the key price drivers in the currency markets.
US Dollar Basket Chart – Daily Candles – Mid-Channel
Source: IG
Friday 14th October marks the start of the Q3 earnings season, with JPMorgan and Wells Fargo sticking with their traditional role of being among the first big corporations to update investors. Banks’ role as a bellwether of the rest of the economy means their reports often offer investors an insight into which way all stocks might next head.
Instrument | Price | Hourly | Daily |
EUR/USD | 0.9728 | Strong Sell | Strong Sell |
GBP/USD | 1.1101 | Neutral | Sell |
USD/JPY | 145.26 | Sell | Strong Buy |
S&P 500 | 3,633 | Strong Sell | Strong Sell |
NASDAQ 100 | 11,020 | Strong Sell | Strong Sell |
FTSE100 | 6,962 | Strong Sell | Strong Sell |
Gold | 1,687 | Strong Sell | Strong Sell |
Crude Oil WTI | 91.64 | Strong Buy | Strong Buy |
Bitcoin | 19,389 | Strong Sell | Neutral |
Ethereum | 1,316 | Strong Sell | Sell |
UTC: 09:22
Our trading signal analysis is based on a comprehensive summary of market data. We use a range of metrics with weighting given to simple and exponential moving averages and key technical indicators.
We created this Weekly Tips section to share possible trade entry and exit points based on our technical analysis. We also have other methods to validate our trades which we can’t publicly share that help to increase their success. All our trades include entry and at least one target price. Stop losses are applied at the reader’s discretion. Our strategies typically trade with a wide stop loss, and risk is further mitigated by trading in small sizes.
Forex
GBPUSD
For forex traders looking for above-average price volatility, Cable remains the market to head to. Uncertainty in the domestic political scene has fed into GBPUSD prices. While the annual round of political party conferences is nearing completion, a quieter Westminster alone doesn’t necessarily mean less noise in the sterling currency markets.
Monday’s announcement by the Bank of England that it will double down on its UK bond-buying program reflects the uncertainty surrounding the pound. The BoE will now be stepping in to buy up to £10bn of gilts, rather than the £5bn first announced.
The scheme was introduced after the new Truss government’s mini-budget caused uncertainty and is due to end on Friday 14th October. Following Monday’s news, investors have to decipher the meaning of the Bank’s decision to ramp up the buying program four days before it’s due to cease.
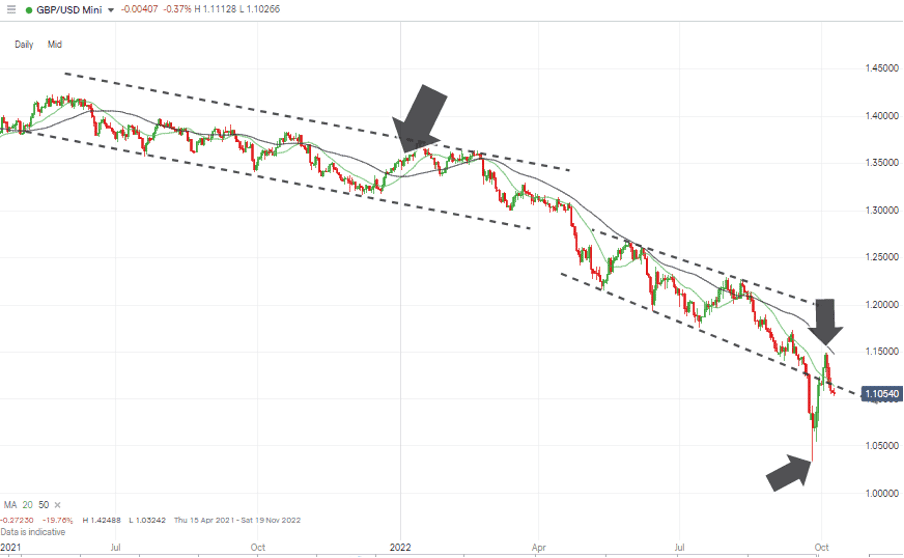
GBPUSD Chart – Daily Candles – Holding Pattern on Supporting Trendline
Source: IG
Developments in the bond-buying program come just as GBPUSD is consolidating on the lower trend line of the price channel dating from April 2022. That leaves the door open to a move either side of that critical support level.
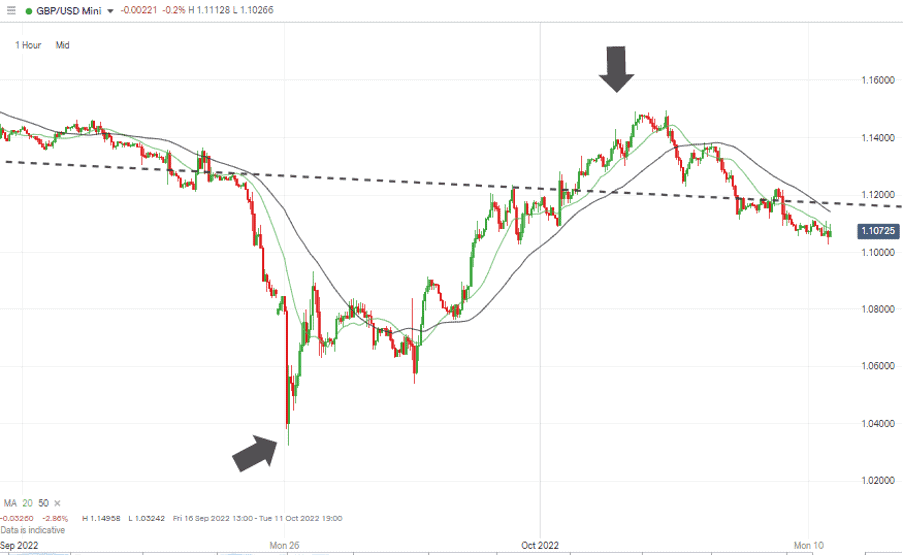
GBPUSD Chart – Hourly Candles – Consolidation Pattern
Source: IG
Short positions
- Entry Level 1: 1.120 – Region of the lower trendline dating from April 2022. Previously offered support and now offers resistance. Also, round-number price level and region of the 50 SMA on the Hourly Price Chart.
- Price Target 1: 1.03242 – Multi-year price low printed on Monday 26th September.
- Stop Loss: > 1.14958 – Price high of Wednesday 8th October.
- Long positions
- Entry Level 1: 1.1115 – Applying a momentum-based strategy and looking for a breakout above the support/resistance trend line currently positioned in the region of 1.115.
- Price Target 1: 1.14958 – Price high of Wednesday 8th October.
- Price Target 2: 1.20 – In extension. Psychologically important price level and region of the upper edge of the April – October price channel.
- Stop Loss: < 1.03242 – Year to date price low printed on Monday 26th September.
EURUSD
EURUSD continues to trade mid-range of its downward price channel. Whilst the long-term prognosis remains decidedly bearish, the price slide continues to be more measured than that of the GBPUSD market.
Monday’s report from Sentix Investor Confidence pointed to the bad news from the eurozone being far from over. The forward-looking indicator posted a reading of -38.3 for October, a deterioration from the -31.8 recorded in September.
The Ukraine conflict continues to cast a shadow over the issue of German and Italian fuel supplies. Many believe that the first cold snap might well be met with an announcement from Moscow that the Nord Stream pipeline needs to be shut down to allow for ’emergency maintenance’.
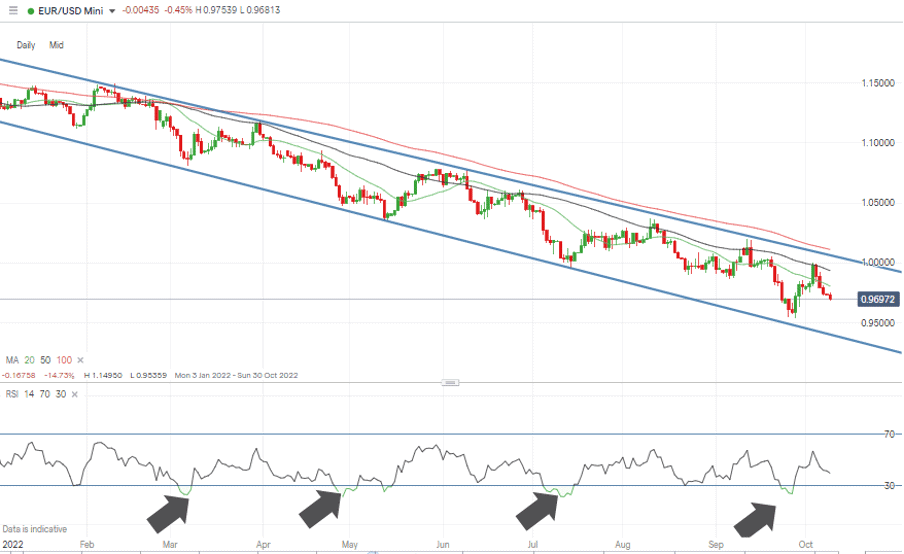
EURUSD Chart – Daily Candles – Trading Mid-Range – RSI at 40
Source: IG
The RSI on the EURUSD Daily Price Chart is trading at 40, which is a slight move from its reading of 42 on Monday 3rd October. With the forex pair currently neither oversold nor overbought on a daily timeframe and with the RSI stable, there appear to be few technical reasons why price might break out of the downward channel.
EURUSD Chart – Monthly Candles – 2000 – 2022
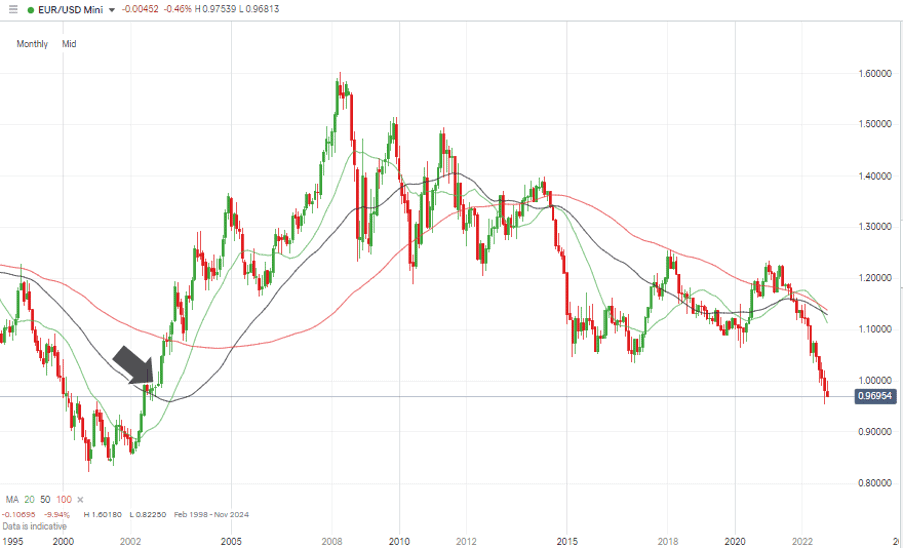
Source: IG
Short positions
- Entry Level 1: 0.99345 – Region of the 50 SMA on the Daily Price Chart.
- Price Target 1: 0.95359 – Year to date price low of Wednesday 28th September.
- Stop Loss: > 1.0000 – Parity price level and region of the upper trendline of the downwards price channel.
Long positions
- Entry Level 1: 0.95359 – Year to date price low of Wednesday 28th September.
- Price Target 1: 0.99345 – Region of the 50 SMA on the Daily Price Chart.
- Price Target 2: 1.0000 – Parity price level.
- Stop Loss: < 0.95359
- Indices
NASDAQ 100
Inflation reports and interest rate guidance continue to dominate the thinking of equity investors, but the end of the coming week marks the beginning of the Q3 earnings season. Some fireworks can be expected as and when the financial statements give a detailed insight into how big business is coping with economic headwinds.
JPMorgan and Wells Fargo kick things off on Friday 14th October, with more big banks and major corporations due to announce their figures in the week commencing 17th October.
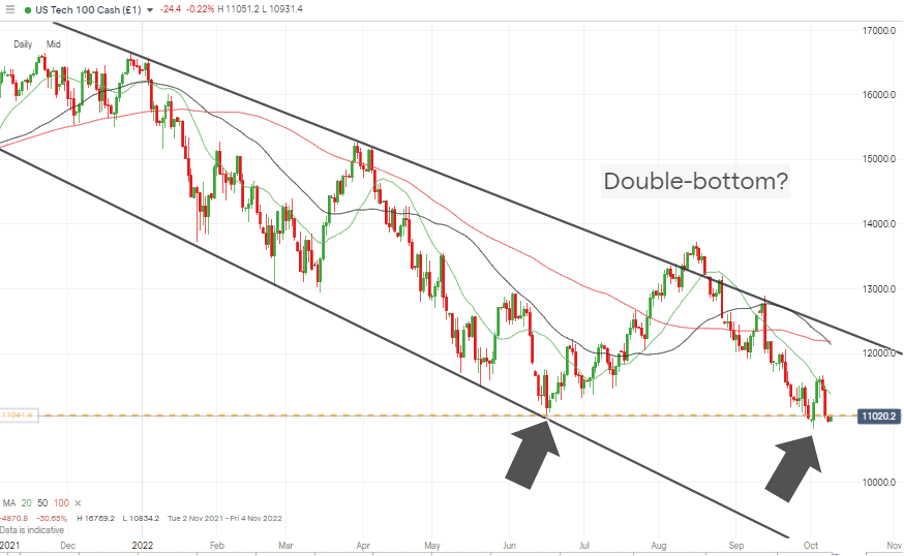
NASDAQ 100 Chart – Daily Candles – Double-bottom?
Source: IG
The interesting proposition for stock traders is whether positive news on earnings could help major indices form a double-bottom price pattern. If the swing-low of 11,036, recorded on 16th June, holds, then there would be a case to argue that the stock markets have bottomed out.
Short positions
- Entry Level 1: 11,036 – Selling into any weakness, which takes price below the key support level formed by the price point of 16th June.
- Price Target 1: 10,000 – Psychologically important price level.
- Stop Loss: >12,134 – Region of a convergence of the 50 and 100 SMAs on the Daily Price Chart.
Long positions
- Entry Level 1: 11,036 – Price low of Thursday 16th September 2022.
- Price Target 1: 11,369 – Region of the 20 SMA on the Daily Price Chart. Acted as resistance to price rally seen during the week commencing 3rd October.
- Price Target 2: 12,000 – In extension, round number price level and just below the 50 and 100 SMA on the Daily Price Chart.
- Stop Loss: < 11,000. Round number price support level.
Crypto – Bitcoin & Ethereum
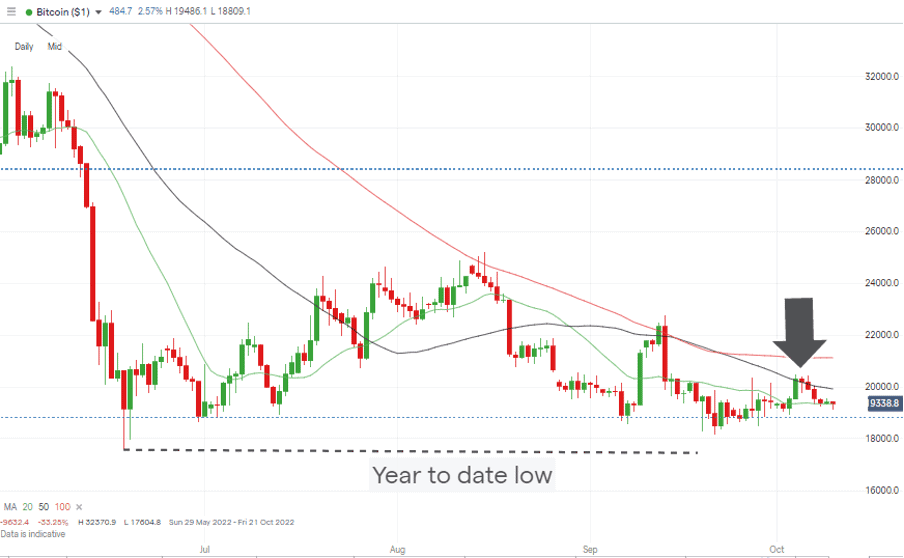
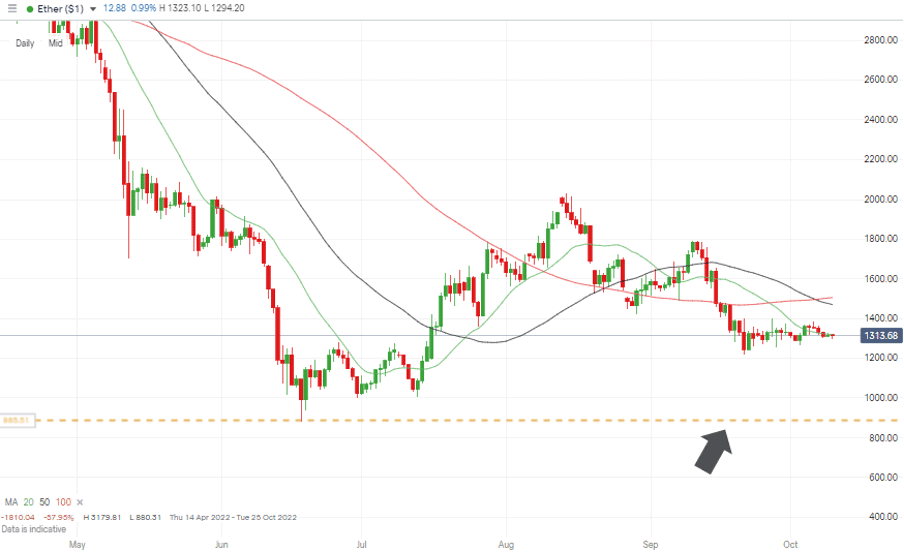
Bitcoin posted another up week and gained just over 2% in value. Ether followed suit and posted at 1% week-on-week return. That may not be the price volatility typically associated with crypto markets, but it is a theme that has been running for several weeks.
Both coins are benefiting from support provided by year-to-date lows. For bitcoin, the basement level support is found at 17,604. Upward price moves have so far been snuffed out by resistance provided by the 20 SMA on the Daily Price Charts of both coins.
Bitcoin Price Chart – Daily Candles – Bounce off 20 SMA
Source: IG
Bitcoin Long positions
- Entry Level 1: 19,353 – Region of the 20 SMA on the Daily Price Chart. A break above this metric would represent a breakout pattern forming.
- Price Target 1: 19,917 – 20,000 – Region of 50 SMA on Daily Price Chart and round number price level.
- Stop Losses: < 17,604 – Year-to-date price low printed on 18th June 2022.
Ethereum
Ethereum Chart – Daily Candles – Bounce off 20 SMA
Source: IG
Ethereum Long positions
- Entry Level 1: 1,319 – Region of the 20 SMA on the Daily Price Chart.
- Price Target 1: 1,500 – Region of the 100 SMA on the Daily Price Chart and psychologically important ’round number’ price level.
- Stop Losses: < 880 – Price low of 17th June 2022.
Risk Statement: Trading financial products carries a high risk to your capital, especially trading leverage products such as CFDs. They may not be suitable for everyone. Please make sure that you fully understand the risks. You should consider whether you can afford to take the risk of losing your money.

Forextraders' Broker of the Month
BlackBull Markets is a reliable and well-respected trading platform that provides its customers with high-quality access to a wide range of asset groups. The broker is headquartered in New Zealand which explains why it has flown under the radar for a few years but it is a great broker that is now building a global following. The BlackBull Markets site is intuitive and easy to use, making it an ideal choice for beginners.