
FOCUS ON: All Eyes On US Inflation Report As Traders Look For Signs That Markets Are Bottoming Out
- US CPI inflation data due on Thursday is the big news event of the week
- Recent strength in EUR and GBP points to price levels bottoming out
- With inflation still being the main price driver in markets, any deviation from the forecast 7.9% rate can be expected to result in an uptick in price volatility.
All eyes are on the US CPI inflation report due on Thursday 10th November. That metric has been the go-to data point for traders for several months, but in an otherwise quiet news week, its importance and impact on prices look set to be magnified.
A Bloomberg survey of market analysts shows the consensus expectation is that the October inflation number will show a 7.9% increase from October 2021. That would be a slight easing from the 8.2% recorded in September and hint that the hawkish Fed interest rate policy is effective.
Any deviation from the 7.9% forecast can be expected to be followed by a period of intense price volatility as traders second-guess how far-reaching future US interest rate hikes might be.
The run-up to what could be a softening inflation number has been marked by dollar weakness. On a week-to-week basis, the euro has strengthened by 0.82%, mainly in the hope that China’s Covid lockdowns might soon ease. A kick-start to China’s economy is seen as likely to result in upward price moves in the growth currencies EURUSD, AUDUSD, and NZDUSD.
From a technical perspective, it could still be too early to consider the dollar’s 2022 bull run as being over. The US Dollar Basket index chart shows price trading in the region of 11,038 and still within the upward price channel, which dates from January. But another test of the support line of that channel is looming, which would mark the second visit to the key support in as many weeks. This is a notable divergence from previous visits to that support when, in March, May, and August, price bounced and experienced upward momentum for weeks rather than days.
US Dollar Basket Chart – Daily Candles – Test Of Trendline Support
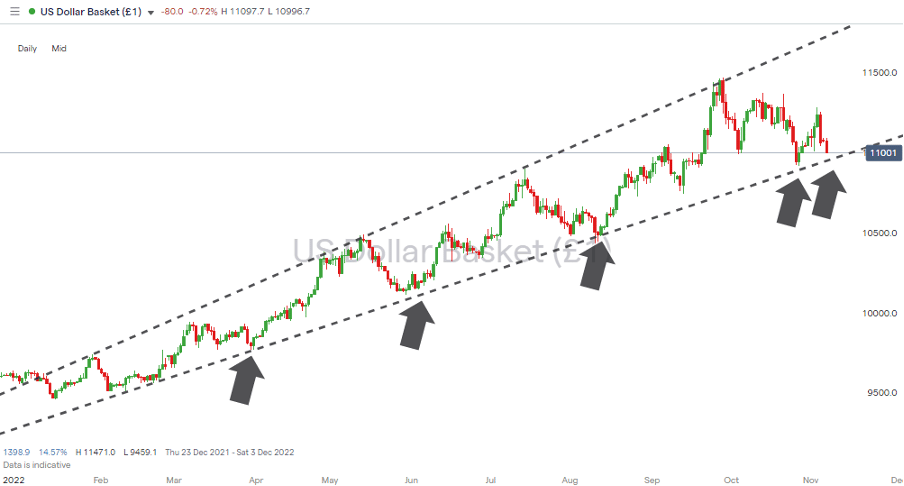
Source: IG
Also read: What is the USD Index?
US earnings season has so far seen banking and tech stocks post a mixture of earnings beats and misses. This week the likes of Disney will update investors on their trading fortunes. That offers traders of all assets a chance to get a take on the financial health of the US consumer.
The firm US jobs number posted on Friday points to the Fed sticking with its aggressive approach to interest rates. That means further price weakness can’t be discounted, but with stocks trading a long way below their start-of-the-year prices, a degree of bottom fishing could see prices tick upwards in the build-up to the US CPI number being released on Thursday.
Instrument | Price | Hourly | Daily |
EUR/USD | 0.9955 | Strong Buy | Strong Buy |
GBP/USD | 1.1349 | Strong Buy | Sell |
USD/JPY | 147.23 | Strong Sell | Neutral |
S&P 500 | 3,765 | Buy | Strong Sell |
NASDAQ 100 | 10,829 | Neutral | Strong Sell |
FTSE100 | 7,316 | Strong Buy | Strong Buy |
Gold | 1,673 | Neutral | Buy |
Crude Oil WTI | 91.08 | Strong Buy | Strong Buy |
Bitcoin | 20,659 | Strong Sell | Strong Buy |
Ethereum | 1,559 | Strong Sell | Strong Buy |
UTC: 09:11
Our trading signal analysis is based on a comprehensive summary of market data. We use a range of metrics with weighting given to simple and exponential moving averages and key technical indicators.
We created this Weekly Tips section to share possible trade entry and exit points based on our technical analysis. We also have other methods to validate our trades which we can’t publicly share that help to increase their success. All our trades include entry and at least one target price. Stop losses are applied at the reader’s discretion. Our strategies typically trade with a wide stop loss, and risk is further mitigated by trading in small sizes.
Forex
GBPUSD
The Bank of England’s decision to increase interest rates last week by 75 basis points was the largest single UK rate rise for 33 years. It puts the BoE in line with other central banks, which have been making moves on that scale for some time, and unsurprisingly it resulted in GBPUSD rallying by 2.12% during Friday’s trading session.
Andrew Bailey, Bank of England Governor, also shared an analysis which points to the UK suffering a “prolonged recession”. With the fundamental prospects of the UK economy in doubt, there is a question mark about how far the current price rally can go.
GBPUSD Chart – Daily Candles – Sideways Wedge Pattern
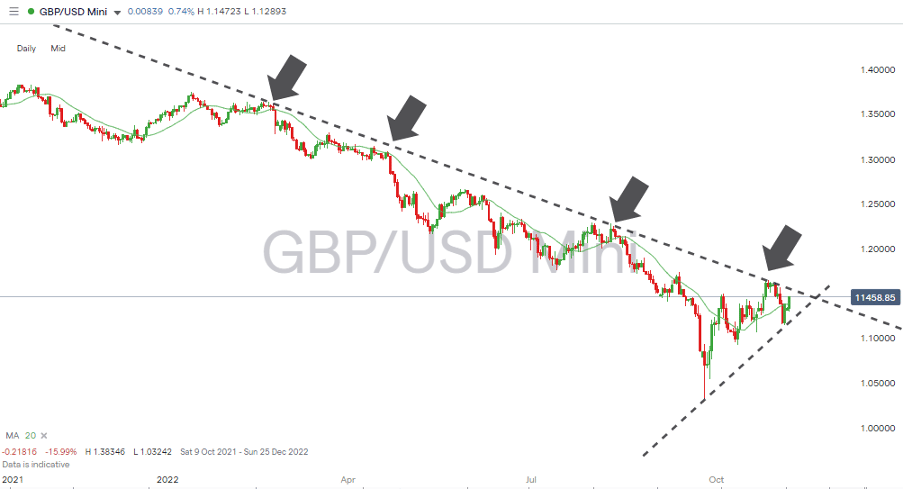
Source: IG
From a technical perspective, the downward resistance trendline dating from February 2022 remains the key metric to watch. Attempts to break above that line were made in February, April, and August, and each failed.
GBPUSD Chart – Hourly Candles – Wedge Pattern Funnel
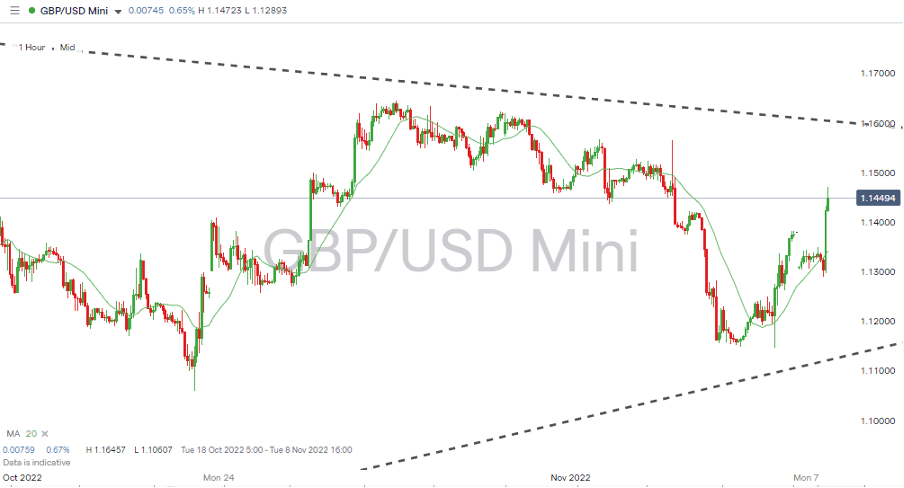
Source: IG
Recent price action has resulted in a sideways wedge pattern forming, based on the low of 1.03242 printed on 27th September. With price currently tracking the 20 SMA on the Daily Price Chart into the end of the funnel, it looks likely that it will be the US CPI data on Thursday that determines whether the break is to the upside or downside. Until then, a period of sideways trading could offer opportunities for those running scalping strategies.
Short positions
- Entry Level 1: 1.15648 – Selling into strength in the region of the downward trendline which has acted as resistance since February 2022.
- Price Target 1: 1.13897 – Region of the 20 SMA on the Daily Price Chart.
- Stop Loss: > 1.15995 – Tight stop loss using the 100 SMA on the Daily Price Chart. GBPUSD hasn’t traded above this metric since 24th February 2022.
Long positions
- Entry Level 1: 1.12863 – Region of the 50 SMA on the Daily Price Chart.
- Price Target 1: 1.15648 – Current region of the downward trendline dating from February 2022. Psychologically important ’round number’ price level.
- Price Target 2: 1.2000 – In extension and following an upward breakout of the wedge pattern. Psychologically important ’round number’ price level.
- Stop Loss: < 1.1100 – Round number price level which sits just below the supporting trendline of the sideways wedge pattern.
EURUSD
During Friday’s session, the euro’s strong rally was triggered by hopes that China’s economy might open back up from Covid lockdowns. The 2.17% intraday appreciation in EURUSD has been followed by a strong opening to Monday’s trading session. It marks a breakout of the downward trendline, which has been in place since February 2022.
The previous break of that trendline which occurred on 25th October ultimately failed, but following the 75-basis point rate hike made by the ECB at their last meeting, demand for the euro appears to be building.
EURUSD Chart – Daily Candles – Breakout?
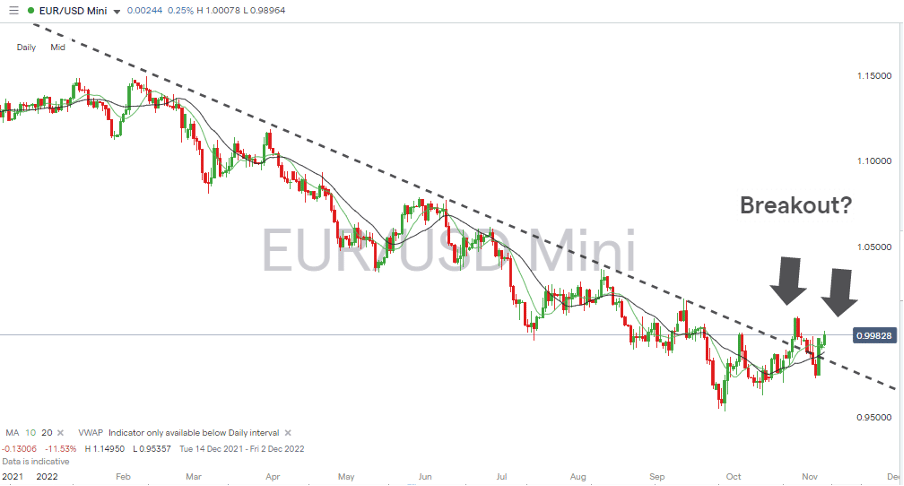
Source: IG
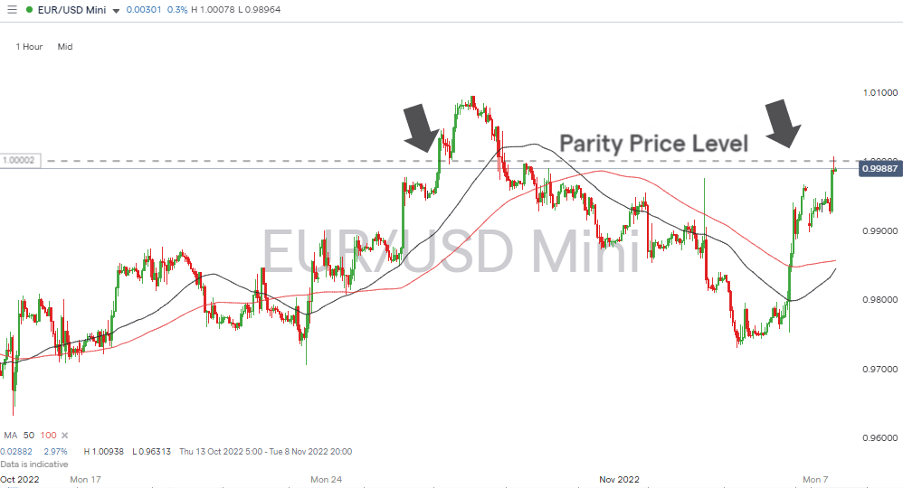
The parity price level of 1.000 remains the critical pivot point for the euro-dollar market. That hugely important psychological price barrier will likely provide considerable support if EURUSD can break above it.
EURUSD Chart – Hourly Candles – Break Above Parity And Retreat
Source: IG
The most recent breakout of the downward price channel has been accompanied by a move by the 20 and 50 SMAs on the Daily Price Chart to trade above the trendline. This added confirmation of the upward move suggests this attempt to rally is better supported than the one of 25th October.
Short positions
- Entry Level 1: 1.000 – Parity price level.
- Price Target 1: 0.98848 – Region of the 20 SMA on the Daily Price Chart.
- Price Target 2: 0.97301 – Price low of week beginning 31st October and swing-low of Friday 21st October.
- Stop Loss: > 1.00154 – Just above the parity price level and region of the 20 SMA on the Weekly Price Chart.
Long positions
- Entry Level 1: 0.98846 – The stiff resistance offered by the parity price level could result in a pullback. The 20 SMA on the Daily Price Chart is positioned just below the 0.99 round number price support and offers a chance to buy into any price weakness.
- Price Target 1: 1.000 – Parity price level.
- Stop Loss: < 0.98571 – Region of the 50 SMA on the Daily Price Chart.
Indices
S&P 500
Tech stocks, including Microsoft, Alphabet, Twitter, Spotify, Meta, Apple, and Amazon, have already released their Q3 earnings reports. The coming week is a chance for the focus to move to other sectors.
Lyft releases its earnings report on Monday 7th November, followed by Disney on Tuesday 8th November. Beyond Meat reports on Wednesday and WeWork on Thursday. The diversity of sectors those stocks cover will offer a broader insight into the financial health of the US consumer. It should allow investors to establish if the worst of the bad news is already priced in.
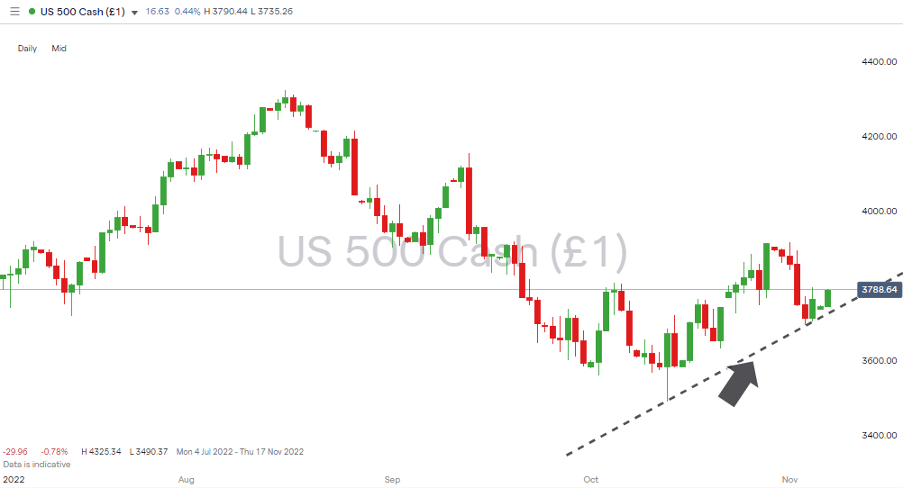
S&P 500 Chart – Daily Candles – Trendline Support
Source: IG
The decision by the Fed on Wednesday 2nd November to continue its hawkish interest rate policy represented a continued move to prioritise the fight against inflation. Some investors had been predicting a more dovish tone and moved into long positions, so the FOMC news was followed by a sell-off, with the S&P falling from 3,858 to 3,749.
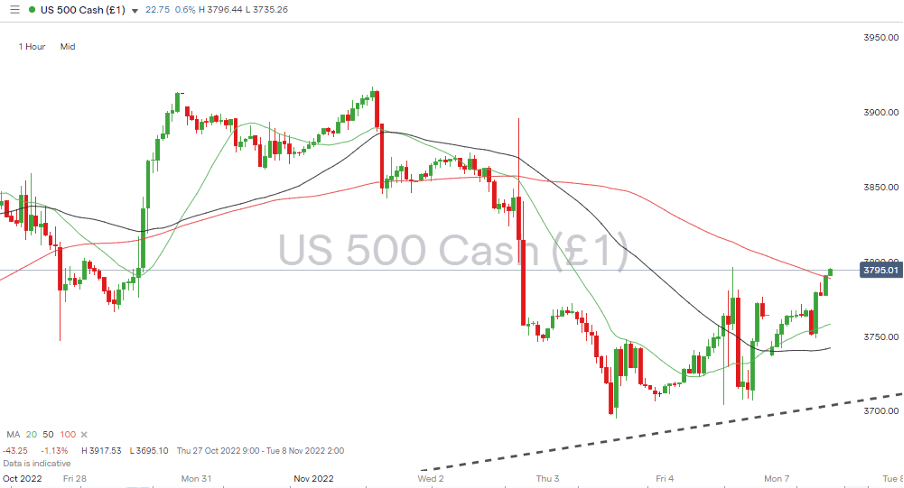
S&P 500 Chart – Hourly Candles – Resistance at 11,668
Source: IG
Short positions
- Entry Level 1: 3,747 – Price is currently sitting on the trendline, which dates back to 13th October. A break of that support would signify the 2022 sell-off continuing for the foreseeable future.
- Price Target 1: 3,490 – Year to date price low printed on Thursday 13th October.
- Price Target 2: 3,400 – Round number price level.
- Stop Loss: >3,913 – Price high of 28th October and region of the 100 SMA on Daily Price Chart.
Long positions
Entry Level 1: 3,747 – Buying into weakness which takes price into the region of the October-November supporting trendline.
- Price Target 1: 3,913 – Price high of 28th October and region of the 100 SMA on Daily Price Chart.
- Price Target 2: 4,000 – In extension, psychologically important price level.
- Stop Loss: < 3,700 – Round number support, which sits below the supporting trendline.
Crypto – Bitcoin & Ethereum
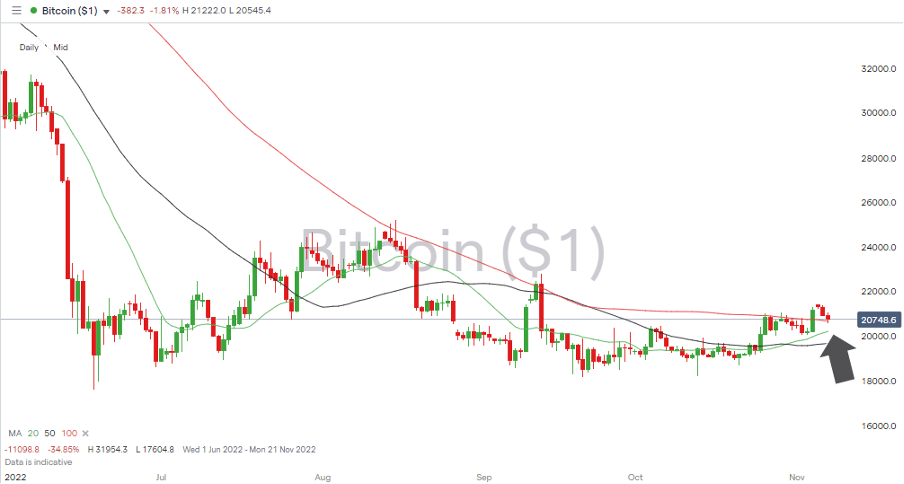
Continued price consolidation by both major cryptocurrencies has resulted in the price of Bitcoin and Ether trading above long-term daily SMAs. Bitcoin’s week-on-week price performance was a modest 1% gain, and Ether also trod water, posting a 1% price fall. Price moves of that scale might not be what crypto traders expect to see but do offer support to the argument that the 2022 sell-off could be bottoming out.
Bitcoin Price Chart – Daily Candles – Trading Above the 100 SMA
Source: IG
Bitcoin Long positions
- Entry Level 1: 20,666 – Region of the 100 SMA on the Daily Price Chart. A pullback to this key metric would offer a chance to enter into positions factoring in further upward momentum.
- Price Target 1: 22,778 – Price high printed on 13th September 2022.
- Price Target 2: 28,205 – Region of the 61.86% Fibonacci retracement support/resistance level, which tracks the rise and fall of the 2019 – 2022 bull market.
- Stop Losses: < 20,000 – Psychologically important price level.
Ethereum
Ethereum Chart – Daily Candles – Break of the 100 SMA
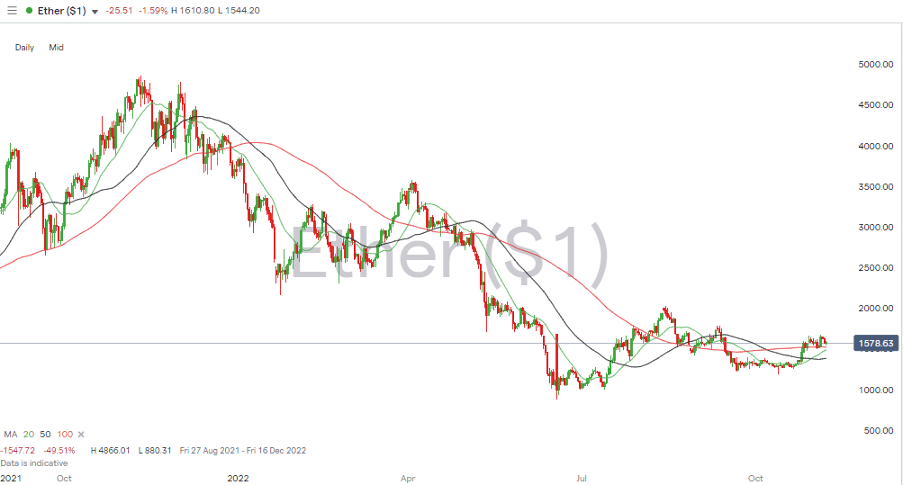
Source: IG
Ethereum Long positions
- Entry Level 1: 1,524 – Region of the 100 SMA on the Daily Price Chart.
- Price Target 1: 1,789 – Price high of 11th September 2022.
- Price Target 2: 2,581 – In extension, region of the 20 SMA on the Monthly Price Chart.
- Stop Losses: < 1,381 – Region of the 50 SMA on the Daily Price Chart.
Risk Statement: Trading financial products carry a high risk to your capital, especially trading leverage products such as CFDs. They may not be suitable for everyone. Please make sure that you fully understand the risks. You should consider whether you can afford to take the risk of losing your money.

Forextraders' Broker of the Month
BlackBull Markets is a reliable and well-respected trading platform that provides its customers with high-quality access to a wide range of asset groups. The broker is headquartered in New Zealand which explains why it has flown under the radar for a few years but it is a great broker that is now building a global following. The BlackBull Markets site is intuitive and easy to use, making it an ideal choice for beginners.