
FOCUS ON: Price Consolidation In Shortened Trading Week
- Markets set to go on hold on Thursday as US celebrates Thanksgiving holiday
- Fed minutes and PMI data releases represent the most likely catalysts for any surprise price moves
- Consolidation patterns could continue to be the dominant theme as market liquidity drops off
The decision as to whether the multi-month bull run in the US dollar has finally turned looks set to be put on hold by the Thanksgiving holiday. In a shortened trading week, the key US exchanges will be closed Thursday and only open for half of Friday. But in reality, most of the week’s business will be completed by Wednesday’s market close.
One major news release that could result in added excitement is the release by the US Fed of the minutes of the last FOMC meeting. Since Jerome Powell and his team met to put through another interest rate rise on 1st – 2nd November there have been signs that US inflation could be losing some momentum.
The minutes from the FOMC meeting won’t factor in the softer CPI report, which was shared on 10th November. But there could be clues within the text that give an idea of how the committee is planning to approach a change in inflation levels.
In an otherwise relatively quiet news week, the main reports of interest focus on PMI (Purchasing Managers’ Index). These offer a view of the upstream condition of the economy and could tilt investor sentiment if the fear of inflation is replaced by concern about a looming recession.
The Germany, US and UK flash PMI reports for November are released on Wednesday 22nd November, with the Australia numbers being released one day earlier.
US Dollar Basket Chart – Daily Candles – Consolidation After Break Of Trendline Support
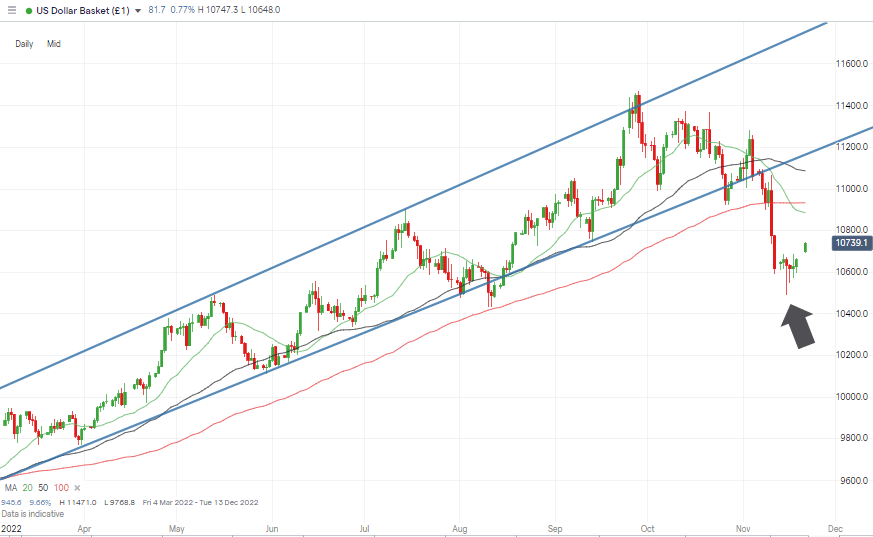
Source: IG
Also read: What is the USD Index?
The US Dollar Basket Index’ dramatic break of the long-term trendline support has been followed by a period of price consolidation. Support in the region of 105.80 has held and another key metric to watch out for is the price low of 104.31 printed on 11th August 2022.
Instrument | Price | Hourly | Daily |
EUR/USD | 1.0256 | Strong Sell | Strong Buy |
GBP/USD | 1.1816 | Strong Sell | Strong Buy |
USD/JPY | 141.16 | Strong Buy | Neutral |
S&P 500 | 3,949 | Strong Buy | Strong Buy |
NASDAQ 100 | 11,632 | Strong Buy | Strong Buy |
FTSE100 | 7,355 | Sell | Strong Buy |
Gold | 1,741 | Strong Sell | Buy |
Crude Oil WTI | 79.77 | Neutral | Strong Sell |
Bitcoin | 15,981 | Strong Sell | Strong Sell |
Ethereum | 1,119 | Strong Sell | Strong Sell |
UTC: 09:26
Our trading signal analysis is based on a comprehensive summary of market data. We use a range of metrics with weighting given to simple and exponential moving averages and key technical indicators.
We created this Weekly Tips section to share possible trade entry and exit points based on our technical analysis. We also have other methods to validate our trades which we can’t publicly share that help to increase their success. All our trades include entry and at least one target price. Stop losses are applied at the reader’s discretion. Our strategies typically trade with a wide stop loss, and risk is further mitigated by trading in small size
Forex
GBPUSD
The autumn fiscal statement provided by the new Chancellor, Jeremy Hunt was generally pessimistic about UK prospects, but his budget was in-line with market expectations. That has resulted in the price of GBPUSD continuing to consolidate in a range between 1.1710 and 1.20293.
The 20 SMA on the Daily Price Chart broke through the 100 SMA on Wednesday 16th November and there is now a bullish alignment of long-term averages. In addition, the Daily RSI (58.2) is still sitting below 60 which points to the market being far from currently oversold in that timeframe.
GBPUSD Chart – Daily Candles – Upwards Break Out of Sideways Wedge Pattern
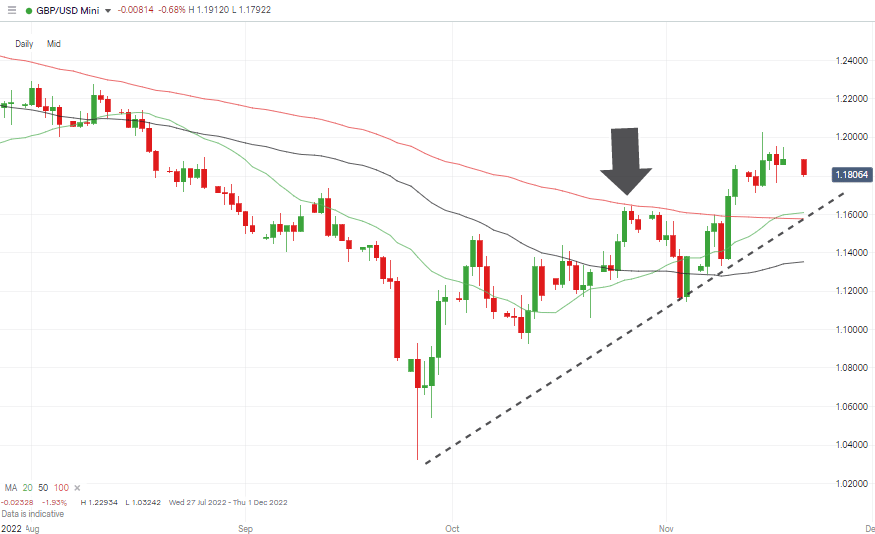
Source: IG
Short-term price charts illustrate GBPUSD making steady progress rather than indulging in a dramatic price surge. The supporting trendline having tested, but so far holding firm.
GBPUSD Chart – Hourly Candles – Steady Progress
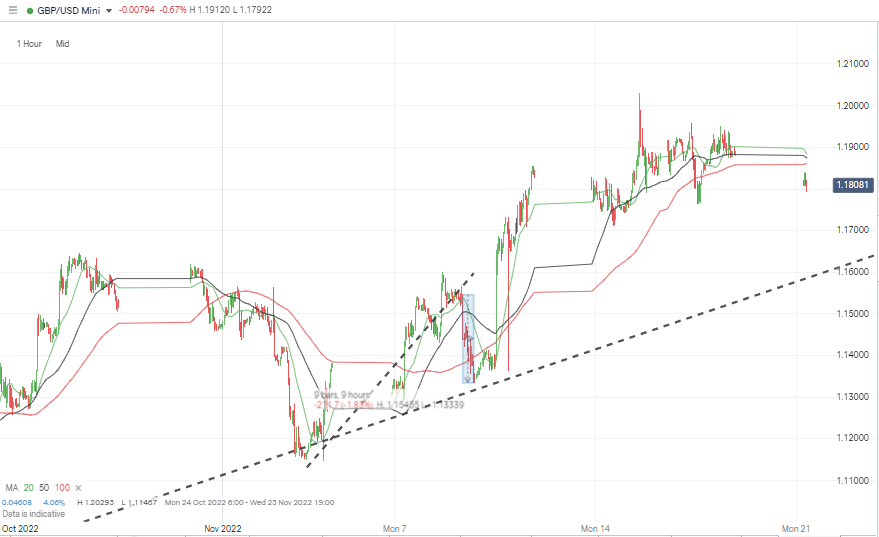
Source: IG
While the trendline dating back to Monday 26th September holds, the path of least resistance appears to be upwards with the next major resistance level being the psychologically important 1.20 price level.
Short positions
- Entry Level 1: 1.2000 – With a break of the upwards trend line looking unlikely short traders running scalping strategies look best placed to enter into positions in the region of the ‘round number’ resistance level.
- Price Target 1: 1.17101 – Weekly price low of 14th November 2022.
- Price Target 2: 1.160 – Region of 20 and 100 SMAs on the Daily Price Chart and current position of the supporting trendline.
- Stop Loss: > 1.20293 – Price high of Tuesday 15th November.
Long positions
- Entry Level 1: 1.15772 – Several price support levels sit in the region of 1.160 but the 100 SMA looks the pick of the bunch thanks to the way it guided price (as a resistance level) on 27th October.
- Price Target 1: 1.2000 – Psychologically important price level.
- Price Target 2: 1.22934 – In extension. Price high of 1st August 2022.
- Stop Loss: < 1.13539 – Region of the 50 SMA on the Daily Price Chart.
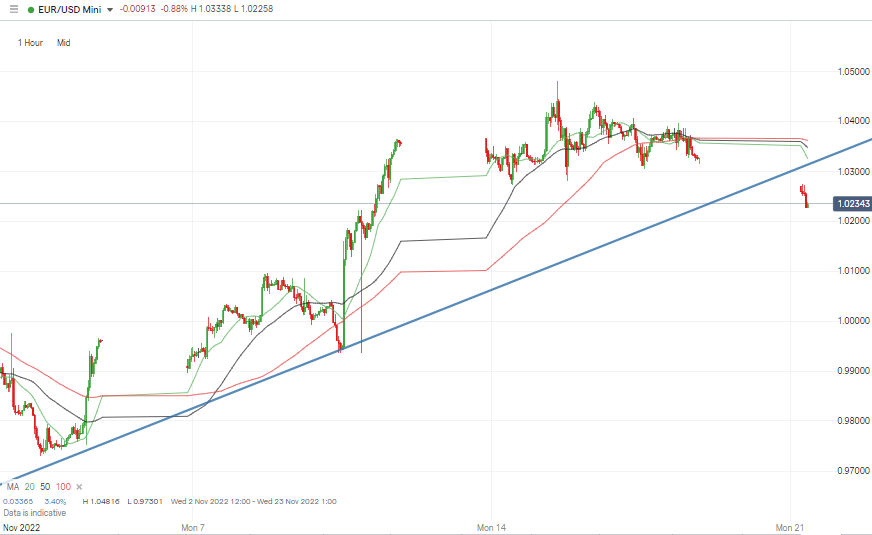
EURUSD
Euro’s sell-off into the close of last week has been followed by further downward price moves during the opening period of Monday’s trading session. The long-term upwards trend remains intact, and the RSI on the Daily Price Chart sits at 57.9, with the recent softness looking like a chance for live prices and daily moving averages to reconnect.
EURUSD Chart – Daily Candles – Divergence from Moving Averages
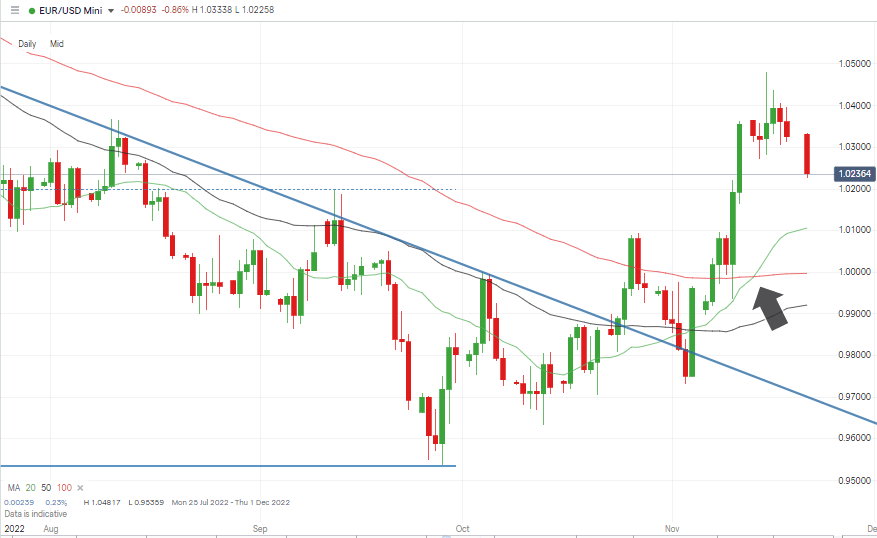
Source: IG
Last week’s trading activity did take price to below the 1.000 parity level for short periods of time but that support level ultimately held. With confirmation that 1.000 looks like the current base level, there will be many looking to buy into any short-term weakness.
EURUSD Chart – Hourly Candles – 20 SMA
Source: IG
The PMI data due on Wednesday could trigger short-term volatility but traders should also factor in that trade volumes are likely to taper off on Thursday due to the Thanksgiving holiday.
Short positions
- Entry Level 1: 1.04817 – Scalping strategy using the price high of Tuesday 15th November as a trade entry point.
- Price Target 1: 1.01062 – Region of the 20 SMA on the Daily Price Chart.
- Price Target 2: 0.99997 – Region of the 100 SMA on the Daily Price Chart and just below the parity price level. Both will offer considerable support to price.
- Stop Loss: > 1.05000 – Round number price level.
Long positions
- Entry Level 1: 1.01062 – Region of the 20 SMA on the Daily Price Chart. Despite the longer-term prognosis pointing to further upwards movement, price is currently extended from the core moving averages. A visit to the 20 SMA is a distinct possibility.
- Price Target 1: 1.04817 – Price high of Tuesday 15th November.
- Price Target 2: 1.061 – 38.2% Fib retracement level of the downwards price move between 7th January and 27th September 2022
- Stop Loss: < 0.99997 – Region of the 100 SMA on the Daily Price Chart and the parity price level.
Indices
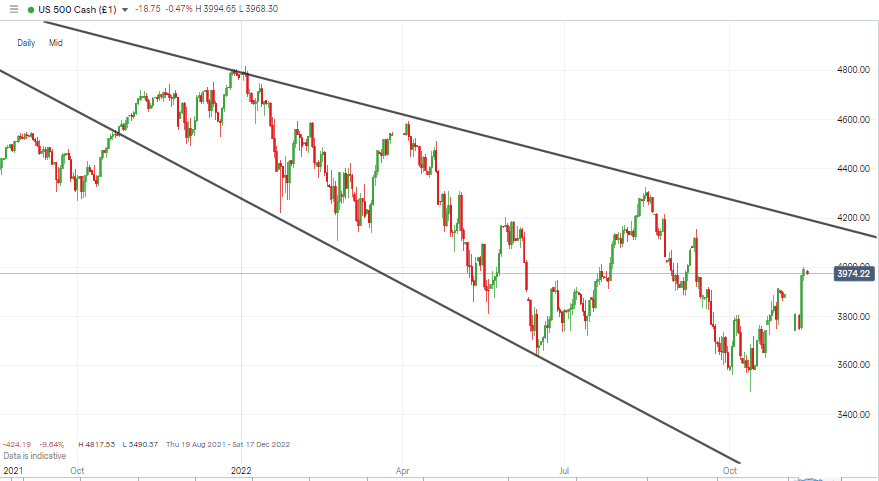
S&P 500
US stocks look set for a quiet week thanks to the national holiday on Thursday and any continued price consolidation would form a base for another leg up. For those following the moves, the 100 SMA on the Daily Price Chart looks like the metric to watch.
Currently trading in the region of 3,916 the 100 SMA was tested intraday on Thursday 17th November and the late rally during that session resulted in the index closing at 3946. In terms of further upwards movement, there are few resistance levels between current price and 4,150 which marks the top end of the downwards price channel which dates back to February.
S&P 500 Chart – Daily Candles – Room For Upwards Movement
Source: IG
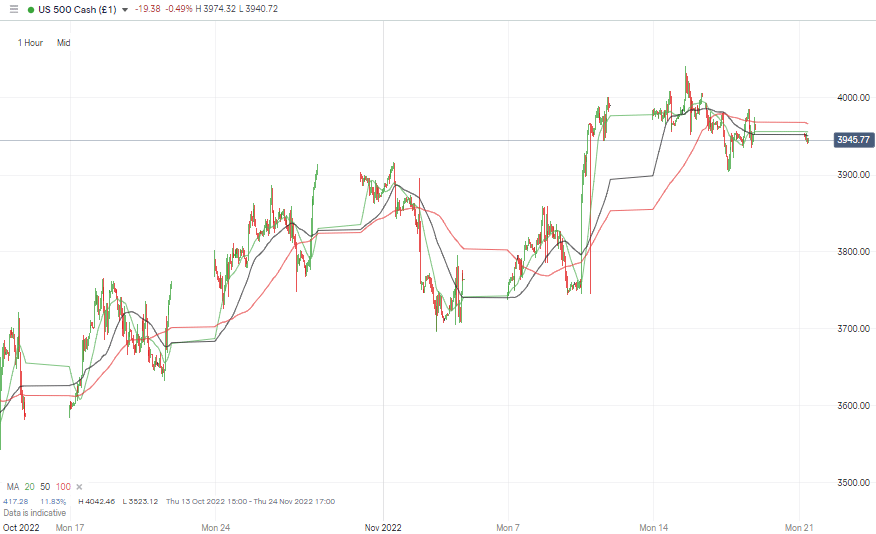
Price patterns on an hourly time frame suggest cash continues to come off the side-lines and back into the stock market. That trend has potential to build further momentum before coming against stiff resistance in the region of 200 SMA on the Daily Price Chart which is currently in the region of 4,200.
S&P 500 Chart – Hourly Candles
Source: IG
Short positions
- Entry Level 1: 4,000 – Psychologically important price level. Tested intraday on Monday, Tuesday and Wednesday of last week and on each occasion, price failed to close above the 4,000 price level.
- Price Target 1: 3,916 – Region of the 100 SMA on the Daily Price Chart.
- Price Target 2: 3,742 – Weekly price low printed on 7th November 2022.
- Stop Loss: >4,200 – Region of upper trendline of the multi-month downwards price channel and 200 SMA on the Daily Price Chart.
Long positions
- Entry Level 1: 3,916 – Buying into any weakness which takes price into the region of the 100 SMA on the Daily Price Chart
- Price Target 1: 4,000 – Psychologically important price level.
- Price Target 2: 4,200 – In extension, region of 200 Daily SMA and the upper trendline of the multi-month downwards price channel.
- Stop Loss: < 3,490 – Year to date price low of Thursday 13th October.
Crypto – Bitcoin & Ethereum
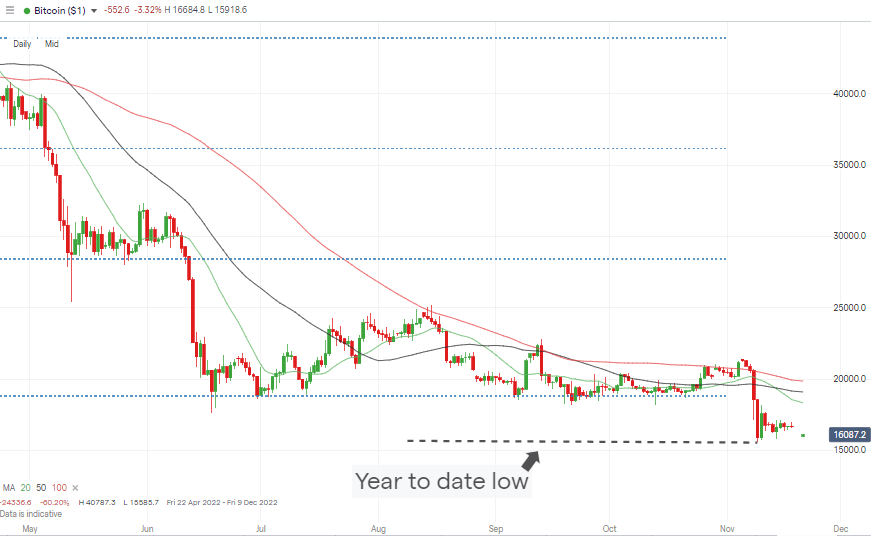
The demise of the FTX exchange has triggered concerns about the health of the entire crypto ecosystem. Bitcoin was down almost 5% on a week-to-week basis while Ethereum posted a price fall greater than 11%.
Bitcoin has posted a new year-to-date low of 15,585 but Ethereum is currently trading above its YTD low of 880.31 which was recorded on 18th June.
With authorities now investigating events at FTX there is a very real risk of operational fears spreading to other exchanges. As specialist crypto brokers are unregulated those looking to buy the current dip may want to consider using a multi-asset broker rather than a coin-only exchange.
Brokers that trade other assets such as stocks, forex and commodities benefit from having revenue streams from a diverse range of markets. Though crypto trades remain out of scope of regulatory protection whichever broker you use.
Bitcoin Price Chart – Daily Candles – New YTD Low
Source: IG
Bitcoin Long positions
- Entry Level 1: 15.585 – Year to date price low printed on Wednesday 9th November
- Price Target 1: 18,338 – Region of the 20 SMAs on the Daily Price Chart.
- Price Target 2: 20,000 – In extension, psychologically important price level.
- Stop Losses: < 15,000 – Psychologically important ‘round number’ price level.
Ethereum
Ethereum Chart – Daily Candles
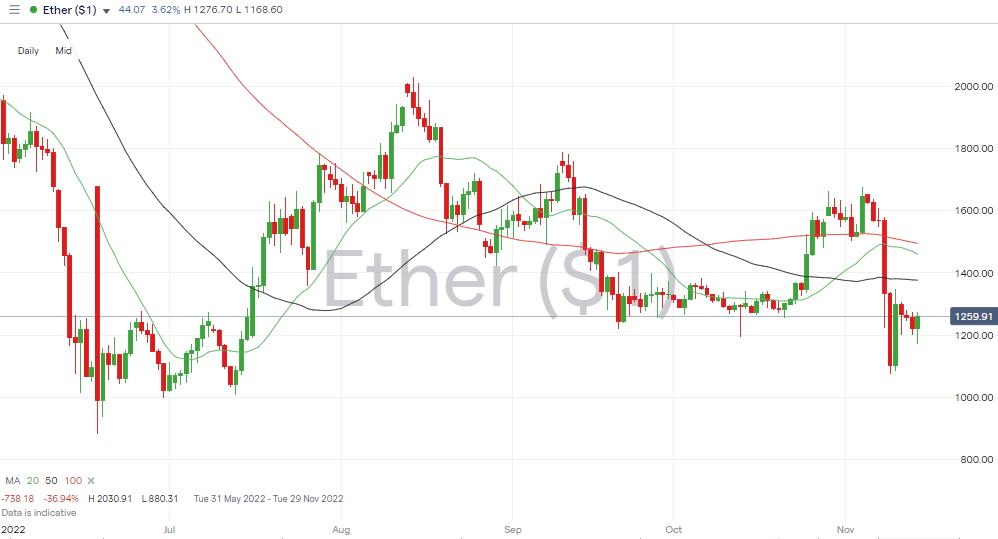
Source: IG
Ethereum Long positions
- Entry Level 1: 1,073 – Price low of Wednesday 9th November.
- Price Target 1: 1,348 – Region of the 20 and 50 SMAs which have converged on the Daily Price Chart.
- Stop Losses: < 880.31 – Year to date price low printed on 18th June.
Risk Statement: Trading financial products carries a high risk to your capital, especially trading leverage products such as CFDs. They may not be suitable for everyone. Please make sure that you fully understand the risks. You should consider whether you can afford to take the risk of losing your money.

Forextraders' Broker of the Month
BlackBull Markets is a reliable and well-respected trading platform that provides its customers with high-quality access to a wide range of asset groups. The broker is headquartered in New Zealand which explains why it has flown under the radar for a few years but it is a great broker that is now building a global following. The BlackBull Markets site is intuitive and easy to use, making it an ideal choice for beginners.