
FOCUS ON: Markets Brace For Central Bank News Overload
- US Fed, ECB, and Bank of England announce new interest rate levels this week
- Monetary policy set to dominate financial markets in data super-dump
- US CPI inflation and UK unemployment reports add extra significance
Traders might be looking forward to quiet Christmas markets and a chance to recharge after a tumultuous 2022, but the coming week is one of the year’s biggest for financial news announcements.
The US Fed, ECB, and Bank of England will all provide updates on interest rate targets. The Federal Reserve releases its numbers on Wednesday 14th, and its European counterparts follow suit on Thursday 15th December.
In the run-up to those potentially explosive updates, the US Consumer Price Index inflation number is updated on Tuesday 13th December. And the far-from-insignificant German ZEW index and UK unemployment data will be released on Tuesday.
From a technical analysis standpoint, forex and equity markets sit at key resistance/support levels. Will this be another point at which the market turns bearish and continues its multi-month move out of risk, or are there surprises in the data which could trigger the market to turn?
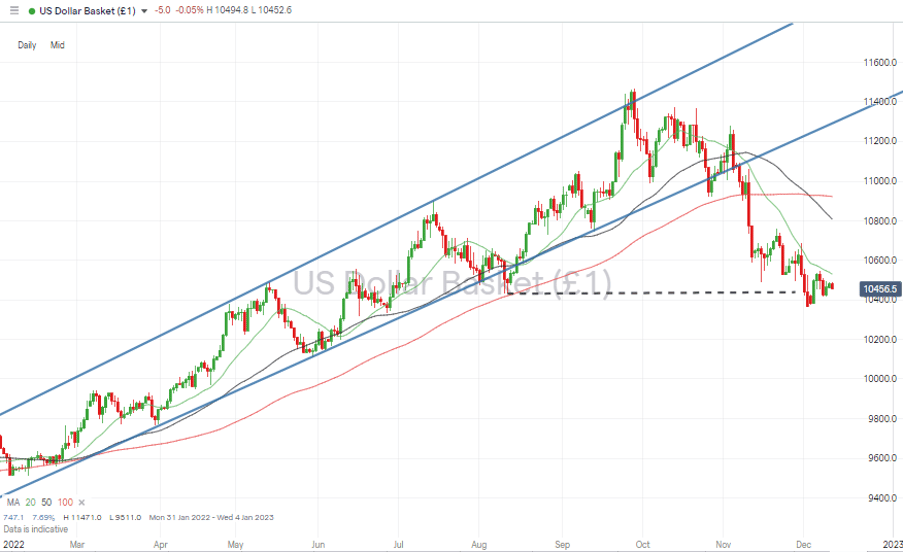
US Dollar Basket Chart – Daily Candles – Consolidation At Price Support
Source: IG
Also read: What is the USD Index?
Change would appear to be on the cards. The Daily Price Chart shows the US dollar consolidating between two round number price bars, 1,400 and 1,500. With such a vast amount of data about to be released, a break from that range appears likely.
Instrument | Price | Hourly | Daily |
EUR/USD | 1.0539 | Strong Buy | Strong Buy |
GBP/USD | 1.2246 | Buy | Strong Buy |
USD/JPY | 136.86 | Strong Buy | Sell |
S&P 500 | 3,931 | Strong Sell | Strong Sell |
NASDAQ 100 | 11,560 | Strong Sell | Strong Sell |
FTSE100 | 7,457 | Strong Sell | Strong Sell |
Gold | 1,789 | Strong Sell | Strong Buy |
Crude Oil WTI | 70.86 | Strong Sell | Strong Sell |
Bitcoin | 16,882 | Strong Sell | Sell |
Ethereum | 1,243 | Strong Sell | Strong Sell |
UTC: 09:42
Our trading signal analysis is based on a comprehensive summary of market data. We use a range of metrics with weighting given to simple and exponential moving averages and key technical indicators.
We created this Weekly Tips section to share possible trade entry and exit points based on our technical analysis. We also have other methods to validate our trades which we can’t publicly share that help to increase their success. All our trades include entry and at least one target price. Stop losses are applied at the reader’s discretion. Our strategies typically trade with a wide stop loss, and risk is further mitigated by trading in small sizes.
Forex
GBPUSD
Given the potential the coming week has to surprise the markets, it’s not surprising that GBPUSD has been forming a relatively stable price pattern. The week-to-week change in the price of cable is -0.03%.
Wednesday’s announcement by the Fed will impact the USD side of the currency pair, and Thursday’s Bank of England report will do the same for the GBP element. Even before that roller-coaster ride starts, crucial economic data is released on Tuesday. The US CPI inflation report will offer an insight into whether inflation has been tamed, and the UK jobs numbers will lift the lid on how bad the UK slowdown really is.
GBPUSD Chart – Daily Candles – Tracking 20 SMA
![]()
Source: IG
The price of GBPUSD is still tracking the 20 SMA on the Daily Price Chart. Until that level is broken, the path of least resistance appears upward.
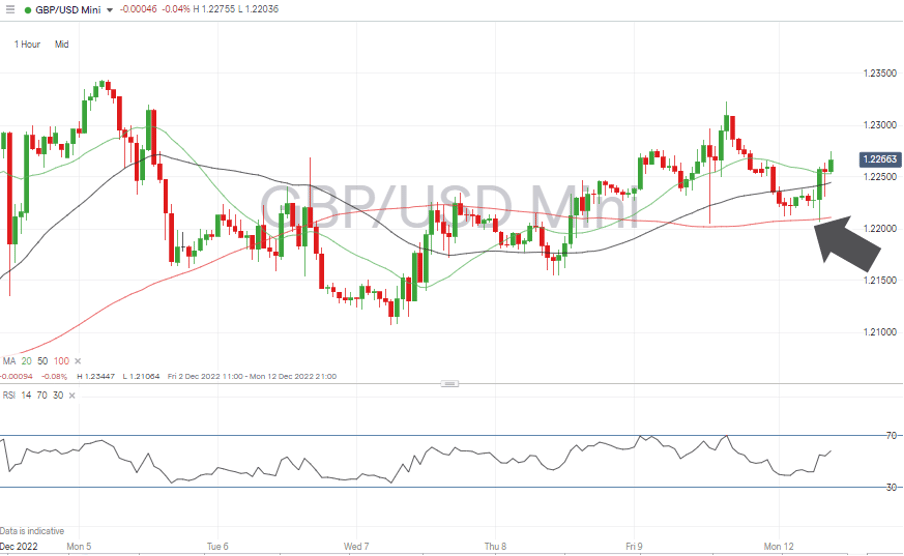
On the Hourly Price Chart, it is the 100 SMA herding price. Over the last week, deviations away from that metric have been followed by a reversal to fall back in line with that long-term average. But with such important announcements in the pipeline, that period of sideways trading could be about to come to an end.
GBPUSD Chart – Hourly Candles – 100 SMA
Source: IG
The RSI on the Daily and Hourly Price Charts is far from being overbought. That leaves room for GBPUSD to surge in price if the BoE rate hike on Thursday is higher than the expected 50 basis points or if the Fed offers any dovish guidance when posting its rate rise on Wednesday, also forecast to be 50 basis points.
Short positions
- Entry Level 1: 1.21147 – Region of the 20 SMA on the Daily Price Chart. Price has traded above this metric since 10th November, and a confirmed break of this support level would open the door to further downward movement.
- Price Target 1: 1.2000 – Psychologically important price level.
- Price Target 2: 1.17539 – Region of 50 SMA on Daily Price Chart.
- Stop Loss: > 1.23447 – Price high of Monday 5th December.
Long positions
- Entry Level 1: 1.23447 – Applying a breakout strategy should central bank announcements lead to price trading higher than the high of Monday 5th December.
- Price Target 1: 1.24000 – Round number price resistance.
- Price Target 2: 1.26497 – In extension, price high of 31st May 2022.
- Stop Loss: < 1.2000 – Round number support level.
EURUSD
Analysts predict the ECB will deliver a 50-basis point interest rate rise on Thursday. This appears to be taking the middle ground and factors in the need to reduce inflation while at the same time supporting the struggling eurozone economy. It’s far from a silver bullet for either of those problems, so further rate rises can be expected in the new year.
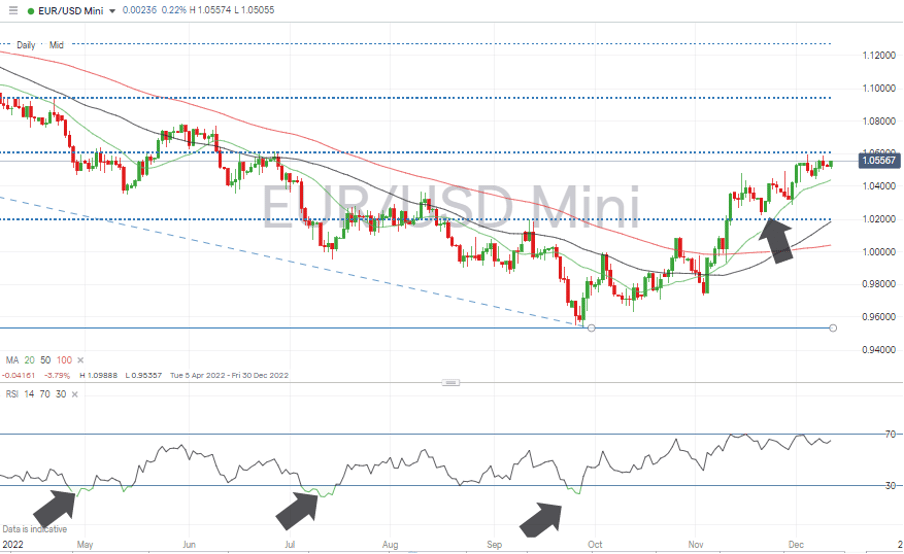
Now holding above 1.055, EURUSD continues to trade at price levels not seen since June, and the path of least resistance appears to be upward. The RSI on the Daily Price Chart is at 64.7, which leaves room for upward price movement.
EURUSD Chart – Daily Candles – Price Consolidation
Source: IG
If price can break through the round number 1.06 level, there is room for a move to test June’s swing-high of 1.0774. The 38.2% Fib retracement of the price fall from January 2021 to September 2022 sits at 1.061 and stands in the way, so profit-taking on long positions would be advised.
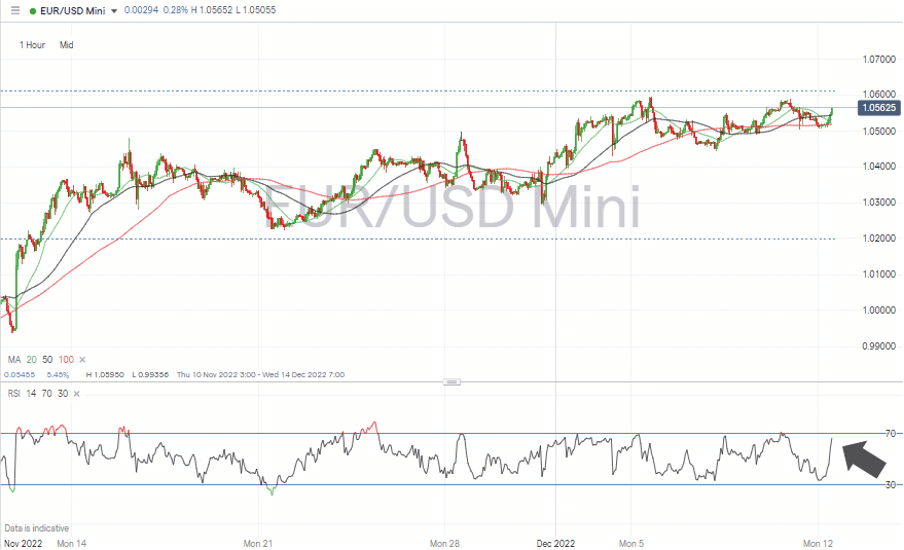
EURUSD Chart – Hourly Candles – RSI Approaching 70
Source: IG
The RSI on the Hourly Price Chart is skyrocketing towards 70 and is being oversold, suggesting a short-term pullback could be imminent. That looks like a side-show compared to the potential for price moves after the ECB’s interest rate announcement on Thursday, which is the big Eurodollar news event of the week.
Short positions
- Entry Level 1: 1.0595 – Price high of Monday 5th December and round number resistance.
- Price Target 1: 1.04410 – Region of 20 SMA on Daily Price Chart.
- Price Target 2: 1.0400 – Round number support level, which acted as resistance between 15th and 30th November.
- Stop Loss: > 1.061 – 38.2% Fib retracement level of the downward price move between 7th January and 27th September 2022. Also close to the price high of 1.0615 on 27th June 2022.
Long positions
- Entry Level 1: 1.0595 – Applying a breakout strategy should price trade higher than the high of Monday 5th December.
- Price Target 1: 1.0774 – Price high of 9th June 2022.
- Stop Loss: < 1.04410 – Region of 20 SMA on Daily Price Chart.
Indices
S&P 500
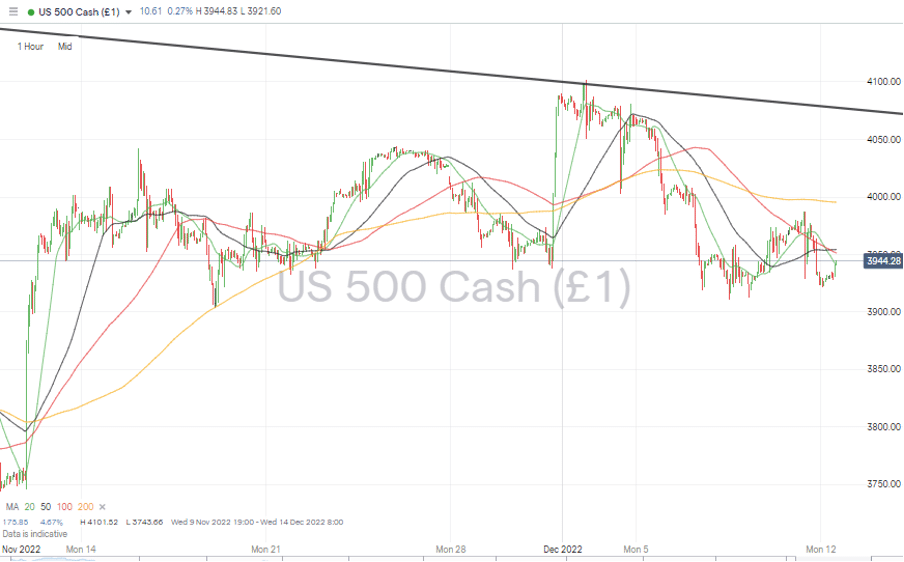
The rally in US stocks that started in October has taken the price of major indices to the upper end of the downward price channel, which has guided price throughout 2022. There is potential for more upside in the S&P 500 index before price tests the resistance found in the region of 4,000, but without a breakout taking place, returns on long positions appear capped.
Should the US CPI report come in higher than expected, or Fed guidance point towards adopting a more hawkish stance, then further weakness in stock markets can be expected.
S&P 500 Chart – Daily Candles – Tracking 200 SMA
![]()
Source: IG
With so much at stake, it’s not surprising to find the price of the S&P 500 currently tracking the 200 SMA on the Daily Price Chart. Further range-bound trading can be expected in the first part of the week, with the big data releases likely to trigger a more dramatic reaction.
S&P 500 Chart – Hourly Candles
Source: IG
Short positions
Entry Level 1: 4,000 – Region of the multi-month downward trendline. Round number price resistance.
Price Target 1: 3,915 – Weekly price low posted on Wednesday 7th November 2022.
Price Target 2: 3,887 – Region of both the 50 and 100 SMAs on the Daily Price Chart.
Stop Loss: > 4,100 – Above round number resistance and the 4,101-price high of Thursday 1st December.
Long positions
- Entry Level 1: 4,101– Applying a breakout strategy if the CPI report of Fed rate guidance points to inflation being less of a priority. Looking for momentum to build and a potential Santa rally into the end of the year.
- Price Target 1: 4,148 – Region of the 50 SMA on the Weekly Price Chart.
- Price Target 2: 4,202 – Region of the 100 SMA on the Weekly Price Chart and psychologically important price level.
- Stop Loss: < 4,000 – Region of the supporting trend line of the November rally and the 4k round number price level support.
Crypto – Bitcoin & Ethereum
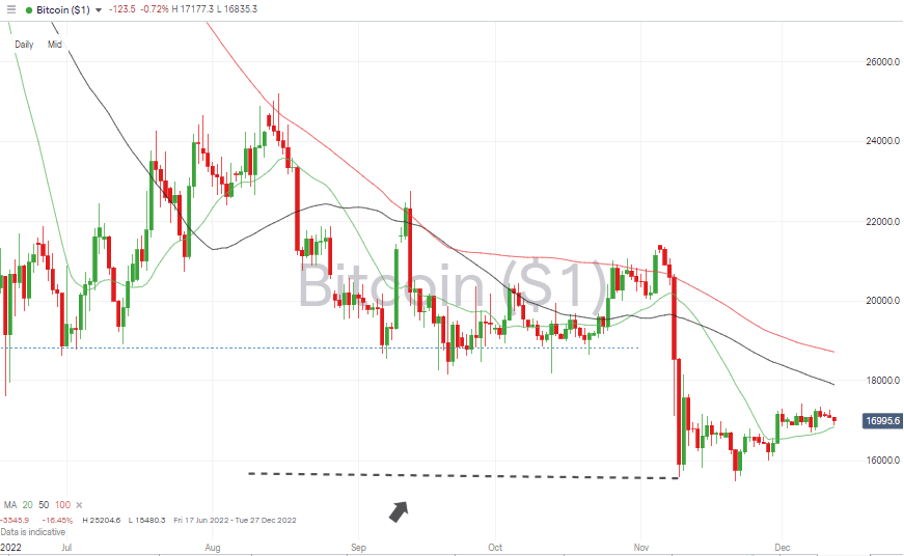
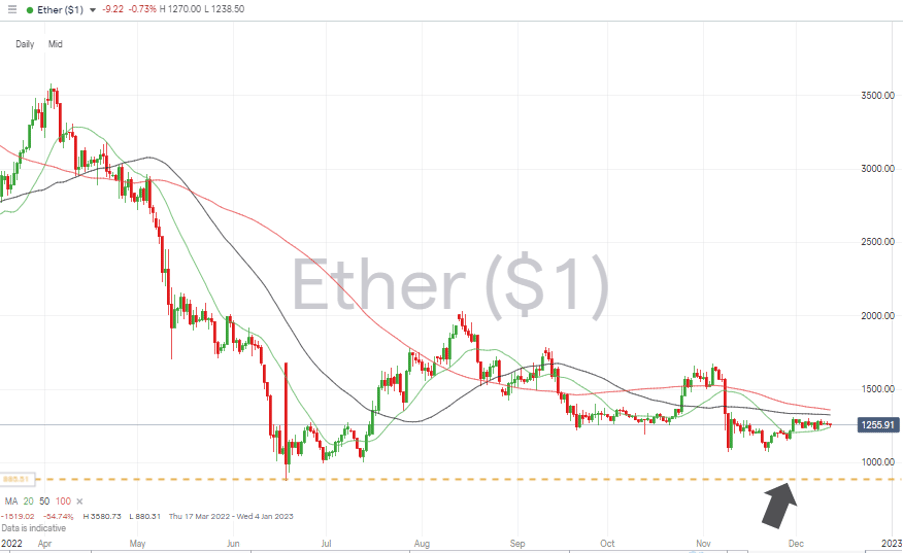
Major cryptos have seen their recovery from the FTX debacle stall. Bitcoin and Ether posted down weeks, with BTC posting a 2.53% price fall and ETH a 4.53% correction.
The good news for holders of both coins is that price continues to trade above the 20 SMA on the Daily Price Chart. A period of consolidation potentially being the most likely outcome as the sector addresses what went wrong at Sam Bankman-Fried’s failed venture.
Bitcoin Price Chart – Daily Candles – Support From YTD Low and 20 SMA
Source: IG
Bitcoin Long positions
- Entry Level 1: 16,841 – Buying into any price weakness using the 20 SMA on the Daily Price Chart.
- Price Target 1: 17,900 – Region of the 50 SMA on the Daily Price Chart.
- Price Target 2: 20,000 – In extension, psychologically important price level.
- Stop Losses: < 15,480 – Year to date price low printed on Monday 21st November.
Ethereum
Ethereum Chart – Daily Candles – Above 20 SMA
Source: IG
Ethereum Long positions
- Entry Level 1: 1,242 – Using the 20 SMA on the Daily Price Chart as a guide for buying into price weakness.
- Price Target 1: 1,360 – Region of the 100 SMA on the Daily Price Chart and just below the round number 1,400 price bar.
- Price Target 2: 1,676 – Price high of 4th November 2022.
- Stop Losses: < 880.31 – Year to date price low printed on 18th June.
Risk Statement: Trading financial products carries a high risk to your capital, especially trading leverage products such as CFDs. They may not be suitable for everyone. Please make sure that you fully understand the risks. You should consider whether you can afford to take the risk of losing your money.

Forextraders' Broker of the Month
BlackBull Markets is a reliable and well-respected trading platform that provides its customers with high-quality access to a wide range of asset groups. The broker is headquartered in New Zealand which explains why it has flown under the radar for a few years but it is a great broker that is now building a global following. The BlackBull Markets site is intuitive and easy to use, making it an ideal choice for beginners.