
FOCUS ON: US Jobs Data Triggers Increased Appetite for Risk-on Assets
- US dollar slides following the release of Non-Farm Payroll numbers
- EUR and GBP rise to test key resistance levels
- All eyes are on the US CPI inflation data due to be released on Thursday 12th January
Instrument | Price | Hourly | Daily |
US Dollar Basket | 103.1700 | Strong Sell | Strong Sell |
EUR/USD | 1.0695 | Strong Buy | Neutral |
GBP/USD | 1.2127 | Strong Buy | Strong Buy |
USD/JPY | 132.10 | Neutral | Strong Sell |
S&P 500 | 3,897 | Strong Buy | Strong Buy |
NASDAQ 100 | 11,052 | Strong Buy | Neutral |
FTSE100 | 7,712 | Strong Buy | Strong Buy |
Gold | 1,875 | Strong Buy | Strong Buy |
Crude Oil WTI | 76.08 | Strong Buy | Strong Sell |
Bitcoin | 16,539 | Neutral | Buy |
Ethereum | 1,309 | Strong Buy | Strong Buy |
UTC: 9:42
Our trading signal analysis is based on a comprehensive summary of market data. We use a range of metrics with weighting given to simple and exponential moving averages and key technical indicators.
We created this Weekly Tips section to share possible trade entry and exit points based on our technical analysis. We also have other methods to validate our trades which we can’t publicly share that help to increase their success. All our trades include entry and at least one target price. Stop losses are applied at the reader’s discretion. Our strategies typically trade with a wide stop loss, and risk is further mitigated by trading in small sizes.
Trading Ideas
US Dollar Basket Index (DXY)
The US Dollar index (DXY) has weakened on the back of US jobs data and increased investor risk appetite. Now testing a fundamental support level, there is room for a potential break to the downside.
US Dollar Basket Chart – Daily Price Chart – Testing Key Price Support Levels
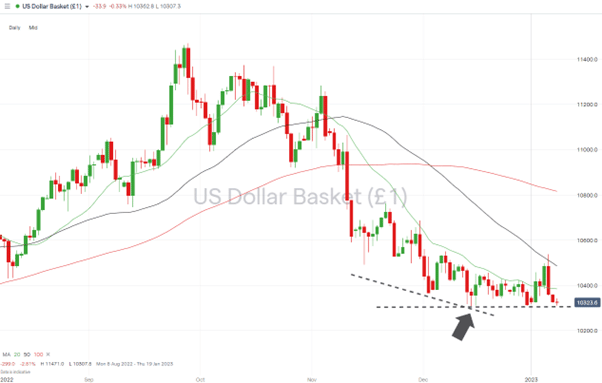
Source: IG
Also read: What is the USD Index?
US Dollar Basket Chart – Hourly Price Chart
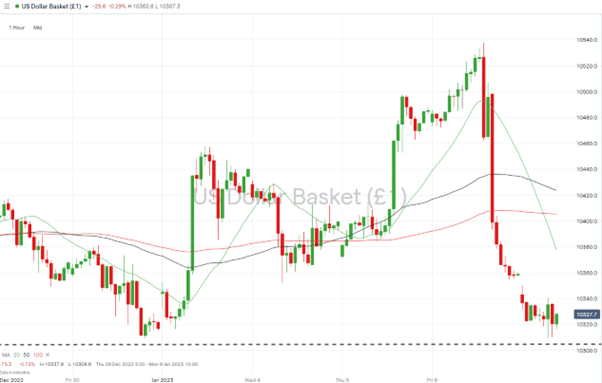
Source: IG
Short positions
- Entry Level 1: 103.84 – Selling into any price rises which take price to the region of the 20 SMA on the Daily Price Chart.
- Price Target 1: 103.07 – Price low of 14th December 2022.
- Price Target 2: 101.10 – Low price recorded in the swing-low price pattern of 30th May 2022.
- Stop Loss: > 104.85 – Region of the 50 SMA on the Daily Price Chart acted as resistance to the upward price move of 6th January 2023.
Long positions
- Entry Level 1: 103.07 – Price low of 14th December 2022. This support has remained intact on previous occasions, notably the intraday low of 30th December 2022, and dates back to the swing-low of June 2022.
- Price Target 1: 105.37 – Intraday price high of Friday 6th January. Current year-to-date high.
- Price Target 2: 108.15 – Region of the 100 SMA on the Daily Price Chart.
- Stop Loss: < 101.10 – Low price recorded in the swing-low price pattern of 30th May 2022.
One indicator to monitor is the 20 SMA on the Daily Price Chart. Price has not closed above that metric since 3rd November 2022. If it continues to act as resistance, further downward price moves can be expected, but a break to the upside would leave headroom for further price gains.
GBPUSD
Cable / GBPUSD has also benefited from the return to risk appetite which has come into the market. The breakout of the downward price channel on the Daily Price Chart points to the path of least resistance being upward.
GBPUSD Chart – Daily Price Chart – Breakout
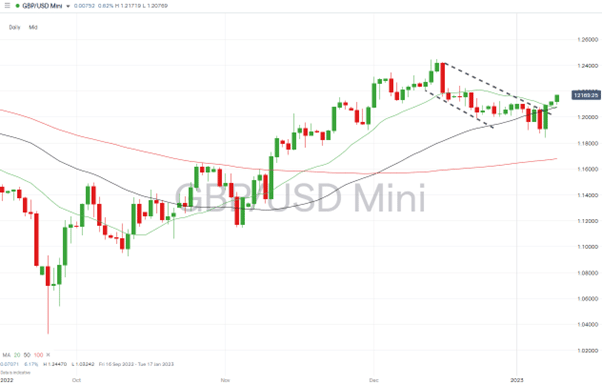
Source: IG
GBPUSD Chart – Hourly Price Chart – 100 SMA Breakout
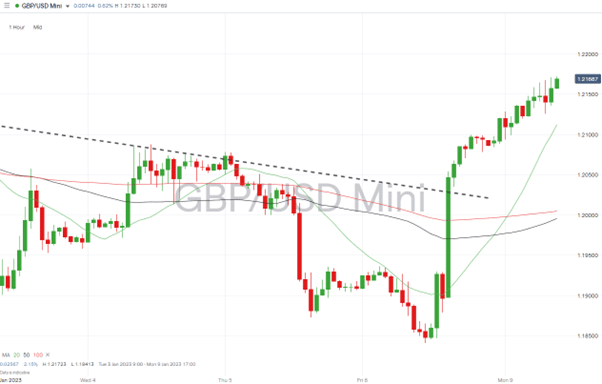
Source: IG
Short positions
- Entry Level 1: 1.22156 – Selling into strength and anticipating a short-term pullback. 1.22156 marks the 61.8% Fibonacci retracement of the price fall between 14th December 2022 and 6th January 2023.
- Price Target 1: 1.2100 – Psychologically important ‘round number’ price level. Acted as resistance in the last week of December 2022
- Price Target 2: 1.20785 – Region of 20 SMA on Daily Price Chart.
- Stop Loss: > 1.23041 – 76.4% Fib retracement of the price fall that occurred between 14th December 2022 and 6th January 2023, and just above the ‘round number’ resistance which can be expected in the region of 1.23000.
Long positions
- Entry Level 1: 1.20750 – Buying into short-term weakness in the region marking the convergence of the 20 and 50 SMA on the Daily Price Chart.
- Price Target 1: 1.21442 – 50% Fib retracement price level.
- Price Target 2: 1.2200 – Round number price resistance.
- Stop Loss: < 1.18413 – Year-to-date price low recorded on 6th January 2023.
EURUSD
Strength in the euro-dollar has taken price to the upper region of its multi-week sideways trading channel. That channel first formed on 1st December and could continue to provide support and resistance to near-term price moves.
EURUSD Chart – Daily Price Chart – Price Channel Holds
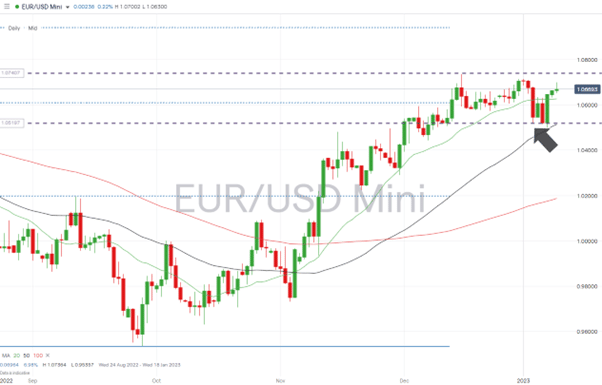
Source: IG
EURUSD Chart – Hourly Price Chart
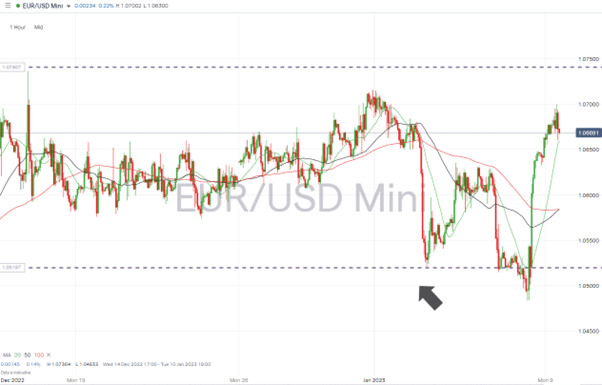
Source: IG
Short positions
- Entry Level 1: 1.07364 – Selling into strength takes price to the region of the intraday price high of 15th December 2022.
- Price Target 1: 1.06271 – Region of 20 SMA on Daily Price Chart.
- Price Target 2: 1.04823 – Year-to-date price low of 6th January 2023
- Stop Loss: > 1.08 – Round number price level above the upper trend line of the sideways price channel.
Long positions
- Entry Level 1: 1.05144 – Region of the 50 SMA on the Daily Price Chart, which has converged with the bottom trend line of the sideways price pattern.
- Price Target 1: 1.06271 – Region of 20 SMA on Daily Price Chart.
- Price Target 2: 1.07364 – Price high of 15th December 2022.
- Stop Loss: <1.04823 – Year-to-date price low of 6th January 2023.
Indices
S&P 500
The US Non-Farm Payroll jobs report released on 6th January 2023 was followed by whipsawing price action. After testing support and resistance levels in both directions, upward momentum has taken price to year-to-date price highs and towards key resistance levels.
S&P 500 Chart – Daily Price Chart – Approaching Resistance
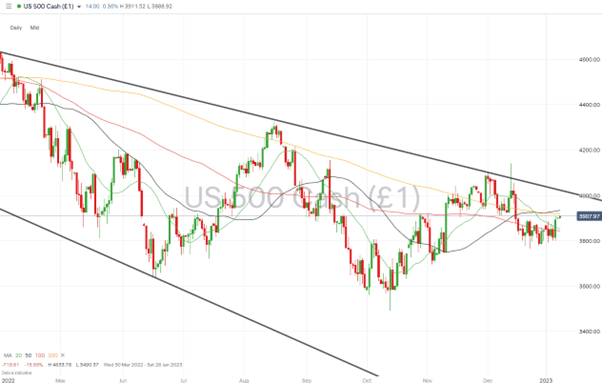
Source: IG
S&P 500 – Hourly Price Chart
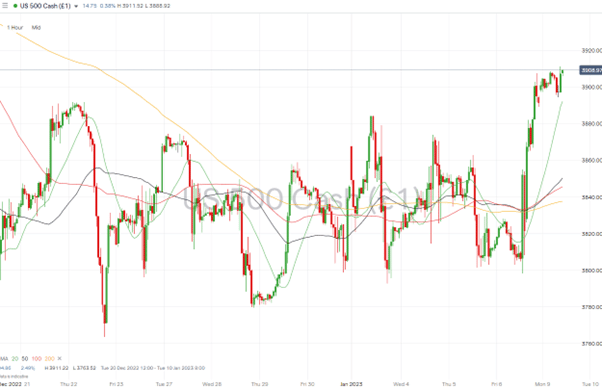
Source: IG
Short positions
- Entry Level 1: 3,917 – Region of the 200 SMA on the Daily Price Chart.
- Price Target 1: 3,850 – Region of the convergence of the 20 and 100 SMA on the Daily Price Chart.
- Price Target 2: 3,763 – Price low of 22nd December 2022.
- Stop Loss: > 4,000 – Region of the resistance trendline of the multi-month downward price channel and ‘round number’ price level.
Long positions
- Entry Level 1: 3,917 – Applying a momentum-based strategy to trade a break out above the 200 SMA on the Daily Price Chart.
- Price Target 1: 4,000 – Region of the resistance trendline of the multi-month downward price channel and ‘round number’ price level
- Stop Loss: < 3,850 – Region of the 20 SMA on the Daily Price Chart.
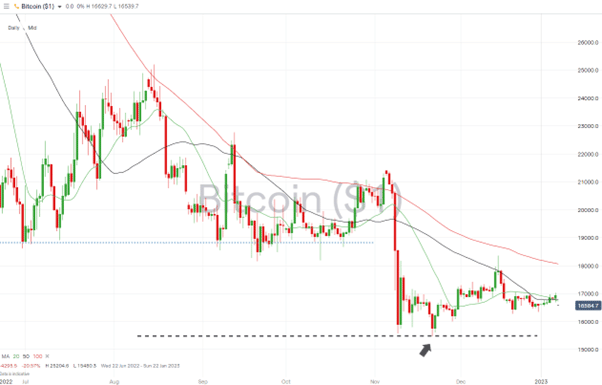
Crypto – Bitcoin & Ethereum
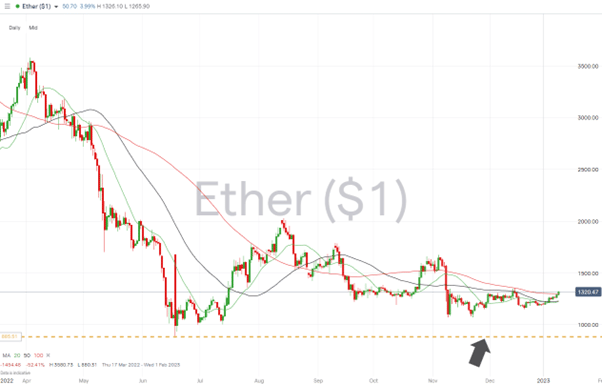
The renewed enthusiasm for risk-on assets has extended to cryptocurrencies, with Ethereum posting the stronger price gains of the two major cryptos.
Bitcoin Price Chart – Daily Price Chart – Trading Above 20 SMA
Source: IG
Bitcoin Long positions
- Entry Level 1: 16,793 – Buying into weakness in the region of the 50 SMA on the Daily Price Chart.
- Price Target 1: 18,064 – Region of the 100 SMA on the Daily Price Chart.
- Price Target 2: 18,369 – Price high of 14th December 2022
- Price Target 3: 20,000 – In extension, psychologically important price level.
- Stop Losses: < 15,480 – Year to date price low printed on Monday 21st November.
Ethereum
Ethereum Chart – Daily Price Chart – Trading Above the 20, 50 and 100, SMAs
Source: IG
Ethereum Long positions
- Entry Level 1: 1,299 – Buying into weakness that takes price back to the region of the 100 SMA on the Daily Price Chart. Also, the 13k psychologically important price level.
- Price Target 1: 1,676 – Price high of 4th November 2022.
- Stop Losses: < 880.31 – Year to date price low printed on 18th June.
Risk Statement: Trading financial products carries a high risk to your capital, especially trading leverage products such as CFDs. They may not be suitable for everyone. Please make sure that you fully understand the risks. You should consider whether you can afford to take the risk of losing your money.

Forextraders' Broker of the Month
BlackBull Markets is a reliable and well-respected trading platform that provides its customers with high-quality access to a wide range of asset groups. The broker is headquartered in New Zealand which explains why it has flown under the radar for a few years but it is a great broker that is now building a global following. The BlackBull Markets site is intuitive and easy to use, making it an ideal choice for beginners.